October 28, 2012

USA and India

As promised, I am back with second installment of my 'NIFTY Comparison with rest of the World' posts. We had already seen Europe and India at the start of the month and in fact it now warrants a re-look at the charts in that post. Will do that sometime. Today, let us see what the US Markets have in store for us. As all of us know that US continues to be largest and most influential market around the World and I do not see any short or medium term threat to its dominance. Any trader or investor anywhere in the World cannot ignore signals from US Markets and we have always been taking cues from it in this blog. Today though I am afraid that I do not have all the positive news for the bulls.

Like Europe, US also has a maze of various indices which you can look at and refer and trade upon. Not only US Dollar, Gold, Commodities, Shipping, Minerals, Oil, etc is decided in US Markets but hosts of Bonds, Money Market Instruments, Exchange Rates and all that has origin and maximum trading there. US Markets also track a variety of sentiments, housing prices, jobless claims and what not. Get the Alice in Wonderland feeling? What we know of them is just the start of the rabbit hole.

Anyway, we will only see the three most directly impacting indices today. Just to keep it simple.

S&P 500


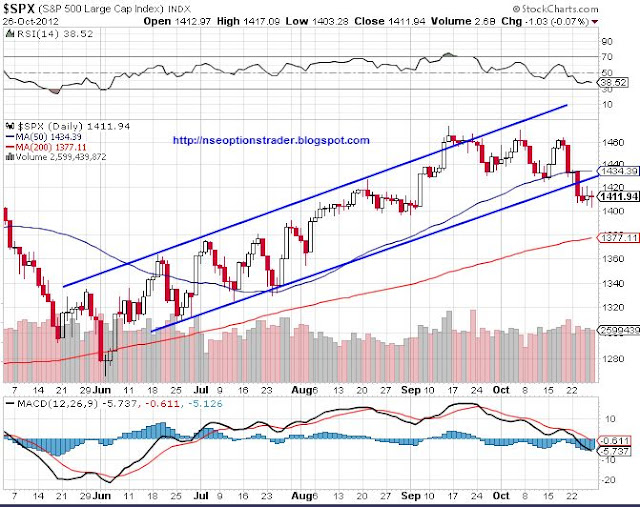
Upward channel is broken as well as 50 Moving Average has been taken out convincingly. Series of higher highs and higher lows is also violated. Now if any of you follow cycle theory then you will know that it is not unusual for corrections in a left translated cycle to go below the earlier low... or in simple terms it may not be a sign of sure shot correction but it still is a threat and considerable at that. Caution advised.

Positive thing is that 200 MA is still at some distance and a close eye to be kept at that level. A bounce above 1435 will give some respite for Bulls though I will not count on that with all my bets.

DJIA


Quite the similar story here too though it is little more bearish than S&P 500. Both these indices are a close reflection of NIFTY in composition and both are showing signs of stress. Most serious signs of problems though come from NASDAQ Composite which may not affect NIFTY as much and as direct as these two.

NASDAQ


NASDAQ appears to be in serious trouble here. It is extremely close to 200 MA and looks to be in downtrend. It is also a victim of below expectations results from Google, Microsoft, Apple and other technology companies. Many of these companies also hold the key to general sentiments of US Investors and hence they do affect everything else indirectly. NASDAQ may bounce from its 200 MA and may go up to upper end of the channel at 3050. Beyond that, it is difficult to say the direction of next move.

Intriguing signals from US and surely interesting times for NIFTY. I am not really interested to drawing any conclusions here for NIFTY and will leave it to you guys to comment on. So let me know what you think of these charts and its possible effects on NIFTY... Will be very happy to have a dialogue on this so don't disappoint me.

Happy Trading as always.
October 24, 2012

Back Again...

Hello there guys n gals. Finally I am back here and totally at loss of words on how to start again. I had to literally go through last few posts to realize where were we and what were we discussing to bring myself up to the speed again. So will try to write something today and my apologies if you find it little off the mark.

Before we proceed, let me wish you all and your loved ones a very happy, prosperous and healthy Vijayadashami... May all the good in your life prevail on everything that is bad... always.

Had planned to write yesterday but then I could not make myself miss the Garba after missing all the fun earlier. It was great and I feel sorry for missing out on most of it. Nevertheless I am so happy to be back among all the festivities and fun and frolic.

Today I cannot make a long post so will just visit the good friend NIFTY to start rolling again and may be I can come back tomorrow with a biggie post. So lets look what have I missed out in last few weeks...


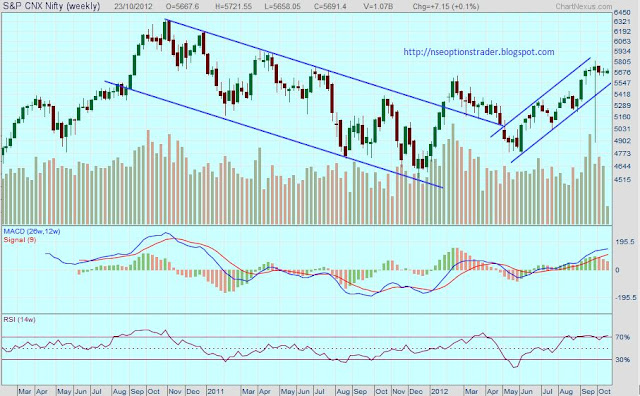
I wish I could remove that freaky line where NIFTY dropped by over 900 points but the software won't allow me. Anyway after breaking the couple of years long down channel, NIFTY appears to be in very stiff upward channel and seems to be going strong barring in between visit to lower line of channel. There are some indicators showing pause in the current rally but I believe quarterly results will set the tone as of now and we may see daily mood swings depending on results from heavyweights.

US Markets are very interestingly poised and their movement in next few sessions is very critical. That means that in all likelihood the next post can be 'America and India'. Hope that I am able to cover for lack of writing in last few weeks by bringing in few interesting reads for you guys. I felt really bad for this absence and I am sure I will have understanding from all of you.

Do let me know what is happening at your end and what would you like to see here. Happy Trading.

October 11, 2012

Apologies

My apologies for this long absence. As I tweeted, I have been traveling a lot and hardly settling at one place to write something. There is absolutely no change in my stance and I will continue to write for time to come and this blog will remain free forever.

I am seriously hoping to write something soon but only constrained by the lack of time at hand. Did not have look at the markets too for some time. Will do that and further writing soon. Happy trading till such time.Will be back with next post.


Sent from mobile.

October 01, 2012

Europe and India

Well, just like last (MACD) post, I cannot delay this one any further. I have been talking about this post for  a while now. Just like I checked few stocks of NIFTY to see any sign of stress in this rally, I wanted to check few global equations as well. Lets get on with that.

Europe

I was slightly confused about which index of Europe should I analyse; choices being German DAX, French CAC40, UK FTSE100, Spanish IBEX or Italian FTSEMI. All of them have their strong reason to warrant a look but given the dearth of time, it was impractical to post all of them. Facing probably same dilemma, some noble fellow has already invented European Top 100 index which tracks the performance of most widely traded 100 stocks across 9 European exchanges and weighed according to total Market Capitalization and Gross National Product of each country. Details of these stocks can be found here. Here is the chart.


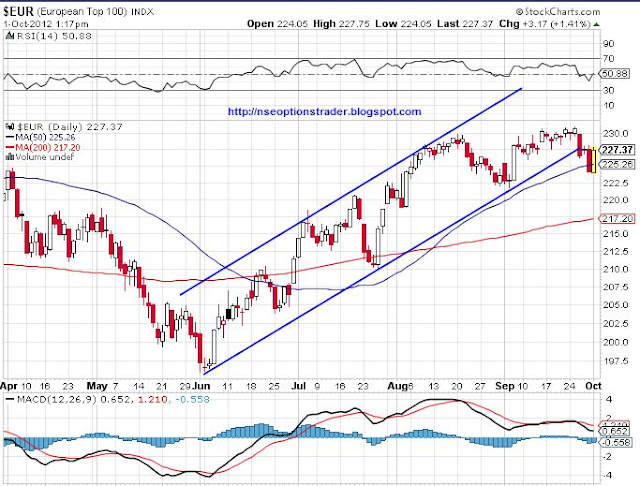
The Index has been nicely moving up since June. It has just now broken the lower line of the channel but that may not be a decisive move. Interesting part is about its close proximity with 50 Moving Average which is at 225.26 and present level of 227.37 is tantalizingly close to it. RSI is at an extremely comfortable level but MACD is showing little drop in momentum though it is not exactly at alarming level.

Very important level to watch out here is low of first week of September which was around 222. A decisive break of that low will mean a lower low negating the present bull run for the first time since it's start. Rest of the indices in Europe are more or less having similar charts and similar predicament. A few more trading sessions should give us some more clarity and possibly very clear (and beneficial) trading opportunity. As of now, as I said, I prefer short side in the present series.

If I wait till I compare everything I want, this post would probably never happen. So I want to make few more post with title like USA and India, Commodities and India, BRIC and India (hope you get the idea) to see how do we fare so far compared to rest of the World and how much steam is left before we roll over to some correction. Hope to get some real time for that which is becoming increasingly difficult. Wish me Luck. Amen.

Happy Trading in the meanwhile.

Support and Resistance

My apologies for not making the post as promised. Having some trouble getting the global charts as I want. Nevertheless I can tell this much that last week we have formed a doji on NIFTY indicating first sign of 'halt' in this rally. Expect some sideways movement if not outright downward.

Even my Twitter handle is having some trouble tweeting a image hence posting Support and Resistance Levels for 01st October here in the blog.


There could be some issue with Java and/or flash, both of them, I updated to latest version. Will sort it out soon but I can say that if at all I am trading October series, I am trading it on short side.

Happy Trading.