Showing posts with label US Markets. Show all posts

March 06, 2013

May not be Deep Trouble

Last time I posted NIFTY Chart, it was October 2012, NIFTY around 5600-5700 and things looked very positive then. Our optimism was not for nothing as NIFTY made high above 6100 and looked all set for more. However, looking at the present chart, there are signs of trouble. See below;

Weekly Chart:


Daily Chart:


US S&P 500:


First about the NIFTY. It has broken the channel after a nice run up. It is stationed between 50 MA and 200 MA now and it is basically in no man's land. After looking at many things I am still not totally convinced that we are in a downtrend. Sure, the correction has been deep but it is not unusual. There have been headwinds in terms of macroeconomic indicators like GDP growth figures, Purchasing Manager Index (PMI) showing slowdown in growth and lack of good news. At the same time there is little positive as in a rational (and not populist) budget, steps to spur growth and some respite in S&P 500 chart.

All in all, 5555 which is around 200 MA is a key level for NIFTY. We may see a play around and may be even test of this level before we get a clear picture.

S&P 500, as you will recall, I think has close relevance with NIFTY is slightly more comfortable though it may be due for a small correction. It definitely seems to be in a better shape than when we last saw it in October. However major risk seems to in terms of US Dollar. It seems to be gearing up for a short to medium (or even long) term top after which a correction becomes due.

What follows with a Dollar correction is a spike in commodity prices including Oil, Precious Metals like Gold, Silver and also Industrial Metals. This strokes inflation around the World and it can spell trouble for the fragile growth that India is aiming for.

I am still trying to catch up with many things. Being away from Markets have given me a fresh perspective and also my thinking is not clouded by barrage of information which sits in subconscious. I will keep looking for some firm cues to find out any trades. At this point, I think it may be a good idea to pick and choose some blue chips for investment purpose. I am having a re-look at some of my long term investments and will try to post more on that. I hope you won't mind if I post some idea (my thoughts) for long term investment rather than positional trade. Anyway I will be looking for Derivative trade also and it may just beat the investment idea to the next post. Whatever it is, it shall come soon.

October 28, 2012

USA and India

As promised, I am back with second installment of my 'NIFTY Comparison with rest of the World' posts. We had already seen Europe and India at the start of the month and in fact it now warrants a re-look at the charts in that post. Will do that sometime. Today, let us see what the US Markets have in store for us. As all of us know that US continues to be largest and most influential market around the World and I do not see any short or medium term threat to its dominance. Any trader or investor anywhere in the World cannot ignore signals from US Markets and we have always been taking cues from it in this blog. Today though I am afraid that I do not have all the positive news for the bulls.

Like Europe, US also has a maze of various indices which you can look at and refer and trade upon. Not only US Dollar, Gold, Commodities, Shipping, Minerals, Oil, etc is decided in US Markets but hosts of Bonds, Money Market Instruments, Exchange Rates and all that has origin and maximum trading there. US Markets also track a variety of sentiments, housing prices, jobless claims and what not. Get the Alice in Wonderland feeling? What we know of them is just the start of the rabbit hole.

Anyway, we will only see the three most directly impacting indices today. Just to keep it simple.

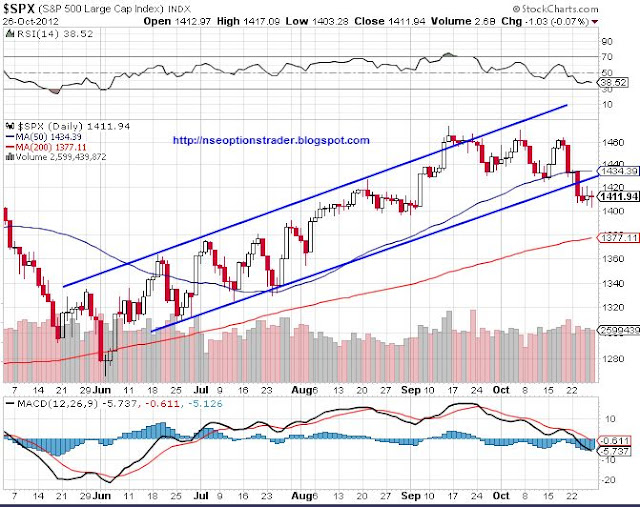
S&P 500


Upward channel is broken as well as 50 Moving Average has been taken out convincingly. Series of higher highs and higher lows is also violated. Now if any of you follow cycle theory then you will know that it is not unusual for corrections in a left translated cycle to go below the earlier low... or in simple terms it may not be a sign of sure shot correction but it still is a threat and considerable at that. Caution advised.

Positive thing is that 200 MA is still at some distance and a close eye to be kept at that level. A bounce above 1435 will give some respite for Bulls though I will not count on that with all my bets.

DJIA


Quite the similar story here too though it is little more bearish than S&P 500. Both these indices are a close reflection of NIFTY in composition and both are showing signs of stress. Most serious signs of problems though come from NASDAQ Composite which may not affect NIFTY as much and as direct as these two.

NASDAQ


NASDAQ appears to be in serious trouble here. It is extremely close to 200 MA and looks to be in downtrend. It is also a victim of below expectations results from Google, Microsoft, Apple and other technology companies. Many of these companies also hold the key to general sentiments of US Investors and hence they do affect everything else indirectly. NASDAQ may bounce from its 200 MA and may go up to upper end of the channel at 3050. Beyond that, it is difficult to say the direction of next move.

Intriguing signals from US and surely interesting times for NIFTY. I am not really interested to drawing any conclusions here for NIFTY and will leave it to you guys to comment on. So let me know what you think of these charts and its possible effects on NIFTY... Will be very happy to have a dialogue on this so don't disappoint me.

Happy Trading as always.