Showing posts with label Fundas. Show all posts

October 28, 2012

USA and India

As promised, I am back with second installment of my 'NIFTY Comparison with rest of the World' posts. We had already seen Europe and India at the start of the month and in fact it now warrants a re-look at the charts in that post. Will do that sometime. Today, let us see what the US Markets have in store for us. As all of us know that US continues to be largest and most influential market around the World and I do not see any short or medium term threat to its dominance. Any trader or investor anywhere in the World cannot ignore signals from US Markets and we have always been taking cues from it in this blog. Today though I am afraid that I do not have all the positive news for the bulls.

Like Europe, US also has a maze of various indices which you can look at and refer and trade upon. Not only US Dollar, Gold, Commodities, Shipping, Minerals, Oil, etc is decided in US Markets but hosts of Bonds, Money Market Instruments, Exchange Rates and all that has origin and maximum trading there. US Markets also track a variety of sentiments, housing prices, jobless claims and what not. Get the Alice in Wonderland feeling? What we know of them is just the start of the rabbit hole.

Anyway, we will only see the three most directly impacting indices today. Just to keep it simple.

S&P 500


Upward channel is broken as well as 50 Moving Average has been taken out convincingly. Series of higher highs and higher lows is also violated. Now if any of you follow cycle theory then you will know that it is not unusual for corrections in a left translated cycle to go below the earlier low... or in simple terms it may not be a sign of sure shot correction but it still is a threat and considerable at that. Caution advised.

Positive thing is that 200 MA is still at some distance and a close eye to be kept at that level. A bounce above 1435 will give some respite for Bulls though I will not count on that with all my bets.

DJIA


Quite the similar story here too though it is little more bearish than S&P 500. Both these indices are a close reflection of NIFTY in composition and both are showing signs of stress. Most serious signs of problems though come from NASDAQ Composite which may not affect NIFTY as much and as direct as these two.

NASDAQ


NASDAQ appears to be in serious trouble here. It is extremely close to 200 MA and looks to be in downtrend. It is also a victim of below expectations results from Google, Microsoft, Apple and other technology companies. Many of these companies also hold the key to general sentiments of US Investors and hence they do affect everything else indirectly. NASDAQ may bounce from its 200 MA and may go up to upper end of the channel at 3050. Beyond that, it is difficult to say the direction of next move.

Intriguing signals from US and surely interesting times for NIFTY. I am not really interested to drawing any conclusions here for NIFTY and will leave it to you guys to comment on. So let me know what you think of these charts and its possible effects on NIFTY... Will be very happy to have a dialogue on this so don't disappoint me.

Happy Trading as always.

October 24, 2012

Back Again...

Hello there guys n gals. Finally I am back here and totally at loss of words on how to start again. I had to literally go through last few posts to realize where were we and what were we discussing to bring myself up to the speed again. So will try to write something today and my apologies if you find it little off the mark.

Before we proceed, let me wish you all and your loved ones a very happy, prosperous and healthy Vijayadashami... May all the good in your life prevail on everything that is bad... always.

Had planned to write yesterday but then I could not make myself miss the Garba after missing all the fun earlier. It was great and I feel sorry for missing out on most of it. Nevertheless I am so happy to be back among all the festivities and fun and frolic.

Today I cannot make a long post so will just visit the good friend NIFTY to start rolling again and may be I can come back tomorrow with a biggie post. So lets look what have I missed out in last few weeks...


I wish I could remove that freaky line where NIFTY dropped by over 900 points but the software won't allow me. Anyway after breaking the couple of years long down channel, NIFTY appears to be in very stiff upward channel and seems to be going strong barring in between visit to lower line of channel. There are some indicators showing pause in the current rally but I believe quarterly results will set the tone as of now and we may see daily mood swings depending on results from heavyweights.

US Markets are very interestingly poised and their movement in next few sessions is very critical. That means that in all likelihood the next post can be 'America and India'. Hope that I am able to cover for lack of writing in last few weeks by bringing in few interesting reads for you guys. I felt really bad for this absence and I am sure I will have understanding from all of you.

Do let me know what is happening at your end and what would you like to see here. Happy Trading.

October 01, 2012

Europe and India

Well, just like last (MACD) post, I cannot delay this one any further. I have been talking about this post for  a while now. Just like I checked few stocks of NIFTY to see any sign of stress in this rally, I wanted to check few global equations as well. Lets get on with that.

Europe

I was slightly confused about which index of Europe should I analyse; choices being German DAX, French CAC40, UK FTSE100, Spanish IBEX or Italian FTSEMI. All of them have their strong reason to warrant a look but given the dearth of time, it was impractical to post all of them. Facing probably same dilemma, some noble fellow has already invented European Top 100 index which tracks the performance of most widely traded 100 stocks across 9 European exchanges and weighed according to total Market Capitalization and Gross National Product of each country. Details of these stocks can be found here. Here is the chart.


The Index has been nicely moving up since June. It has just now broken the lower line of the channel but that may not be a decisive move. Interesting part is about its close proximity with 50 Moving Average which is at 225.26 and present level of 227.37 is tantalizingly close to it. RSI is at an extremely comfortable level but MACD is showing little drop in momentum though it is not exactly at alarming level.

Very important level to watch out here is low of first week of September which was around 222. A decisive break of that low will mean a lower low negating the present bull run for the first time since it's start. Rest of the indices in Europe are more or less having similar charts and similar predicament. A few more trading sessions should give us some more clarity and possibly very clear (and beneficial) trading opportunity. As of now, as I said, I prefer short side in the present series.

If I wait till I compare everything I want, this post would probably never happen. So I want to make few more post with title like USA and India, Commodities and India, BRIC and India (hope you get the idea) to see how do we fare so far compared to rest of the World and how much steam is left before we roll over to some correction. Hope to get some real time for that which is becoming increasingly difficult. Wish me Luck. Amen.

Happy Trading in the meanwhile.

September 24, 2012

Is this Rally for real?

(Caution: Time reference of this post is Friday 22nd September 2012)

Whoa... NIFTY made a 52 week high today. What a rally. Honestly speaking, how many of us were expecting it? We were around 4770 in June with all gloom and doom. We usually have these extremes moodswings before any turnaround. In Jan 2008 there was this height of optimism where one could easily hear all our everyday friends like Chaiwale Bhaisaab, Doodhwale Bhaisaab, Autowale Bhaisaab talking about Sensex and all rag to riches stories that they had to share. And just at the start of this month there was so much pessimism regarding Government, Policy Logjam, Coal-Gate, Parliament Adjournment and what not. Then this massive move today made my last post expecting some fight between bulls ans bears look like a silly joke... so much for news based Markets. So are we out of the woods really... is this rally real and is actually start of a massive Bull Market?

Obviously I do not know. Definitely not yet.

But let us see some facts. That's what we can do and try and decipher some signals from those facts. Today along with NIFTY, there are not one or two but 20 stocks which are close (within 7%) to their 52 weeks highs. Many of them are real close within 2% and some 5% while 4 of them have actually made these highs today itself. These 4 are; Grasim, ICICI Bank, Kotak Bank and HDFC Bank and real close are L&T, HDFC and Ambuja Cement. No wonder most of them are Banking stocks (that actually worries me as well) with all reforms, CRR cut and all that. It may take me few months to write everything about these stock from fundamental analysis point of view and by that time data might have changed already... ruining all my efforts. So I will do what I can do in lifetime of this post... post charts. I will post only one bank stock so that we also cover many sector's stocks in the process (note that stocks here may not be true indication of their respective sectors).

1. Grasim

Found really nothing remarkable about the chart. Just that it is following up NIFTY movement. RSI is in overbought zone but it can stay there at higher levels for longer time. Just look at RSI in August.

2. HDFC Bank

Nothing special again. This script has been taking good support and resistance levels from Moving Average lines. Multiple occasions can be seen above. Right now however, it is comfortably placed above MA lines.

3. Larsen and Toubro

Move from 1300 to 1600 in less than 4 weeks. Very impressive. This script is one of my long time favorite for intra-day as well as long term investments. Its been a laggard for some time in tracking NIFTY but surely trying to play catch up.

4. Ambuja Cement

4 out of 4 charts are showing a Golden Cross where 50 MA has crossed 200 MA from below.
4 out of 4 charts are showing no serious overbought condition.
4 out of 4 charts are showing good moves with above average volumes.
4 out of 4 charts are showing values stretched above their MAs

I am trying to see some sign of exhaustion in the rally and unable to see anything wanting serious caution on NIFTY or its components as of now. What this entails is enjoy the rally while it is in play but keep strict profit targets and stop losses. It is very easy to make notional money in the present market, difficult is to keep it.

Wanted to do this post on Friday itself but was unable for one or the other reasons.... very sorry. I will make another post on similar lines where I will examine major World markets in details to see if they help us in understanding the trend and timelines for this rally.

I should be able to do that tomorrow. Happy Trading till then.

September 19, 2012

Interesting times as usual...

Happy Ganesh Chaturthi to all my readers. May the Lord Ganesh bring happiness, health and prosperity to all of you and your families.

Well, coming back to Blog, I hate to boast but NIFTY just touched 5650 and turned back. It made a high of 5652.2 briefly on Monday and settled to 5600.05 yesterday. If you recall last post, I had hoped a return from the very same level based on plotted Fibonacci levels on the chart. Now I know the next question to your mind is how deep this correction will be? Well, the answer is not simple. Let us try to see both sides of the coin here.

First of all, I am not saying that this is correction at all. I just thought that markets will feel exhausted and run out of steam and will take a pause and it was true for markets around the World. I surely expect some more downward bias courtesy Mamata Didi. She did what she does best and put a spoke in the reform cycle. She would surely have her arguments and (misinformed) advisers to think that FDI is against farmers and 24 cylinders a year is the right amount for a poor household. Her withdrawing support to UPA when she had the option the stop FDI and increase no of cylinders in West Bengal on her own is real hypocrite behavior but it also throws up a real opportunity for UPA to get rid of her for good. She has been the main reason for delay and paralysis on reforms in UPA. Hopefully Government will survive and we will have more steps taken to revive the economy.

On the other side, I do not expect the downward move to be very steep or deep. PC has been very active in Finance Ministry since taking charge and has already made statements that more announcements are in the offing. He has virtually said that RBI will cut interest rates on October 30th (almost) as Government will be taking a lot more fiscal consolidation steps between now and then. Markets will be all ears and will be averse to go down too much anticipating some measures.

Let us see if any clue with Technicals on the chart;


On the chart front, there is hardly any movement since I last posted expect that RSI has turned down a little on daily basis (not shown here). The trendline shown above and also the 50% retracement from Fibonacci levels in last post, both indicate a support at aroud 5430. Now that is pretty deep cut from current level of 5600 but that is a very strong support I would say for the short to medium term (till next week). I will not rule out its possibility completely as a lot will depend on not economic but political news in next few days. I will not underestimate capacity of our polity to spring few surprises. Also we will have some F5 (refresh) movement about problems in Europe and QE3 euphoria will likely take a back seat for some time at least.

Just to summarize, expect a tug of war between Bulls and Bears for some time. Expect good moves on either side and sideways movements, some consolidation (all that) till we get some more clarity about World economy and situation close home. Undoubtedly, we live in interesting times.

All in all, a very uncertain time ahead for next week and half. May Lord Ganesha, Lord of Wisdom give much needed wisdom to the people who matter and they take all the right steps. May everyone is this country and in this World benefit from these steps and lives of all the people get better and better.

Happy Trading.

September 16, 2012

Forget Fed... its all happening in India

Friday evening, Government of India made some bold announcements. There was nothing new or radical but these announcements came at a totally unexpected time and pace. Following up the Diesel hike and subsidized LPG cap, GoI cleared FDI in Retail, Aviation and Cable. Government also cleared divestment in four companies. PM statement that, 'If we have to go down, we will go down fighting' makes one think that GoI may be serious this time in pushing these steps through. Mamata tried (as usual) to play the spoil-sport by giving 72 hour ultimatum for rollback which will be ending tomorrow evening. There will be a meeting of TMC on Tuesday to decide further course of action. Been tweeting about it and I hope you guys are reading those tweets on the blog.

But focusing on the positive part as of now; what these announcements did is more than the symbolic value of their benefits (which is huge). Suddenly there is a sense of hope and a sense of purpose or direction within the UPA Government. These moves may well serve two big purpose in the immediate term. First, it may just save us from the shame of becoming the first BRIC economy to loose investment grade rating. Now this again may or may not be a big deal for India but it would have badly affected the already in trouble Private Sector. Maintenance of the rating will help Indian companies to keep cost of overseas borrowing in check (though it is already bad due to change in INR/$ equation)

Secondly, it may just give RBI some room on Monday to start thinking about cutting rates. There is more than just whispers by Pundits that RBI may continue what GoI has started. There is widespread belief that RBI may join the party and cut the rates today. If you remember the last policy statement by RBI it was clear that RBI wanted some policy actions from Government before any rate cuts. Though the Inflation (around 7.55%) is hardly anywhere near the comfort zone of RBI but slippage in growth may just prompt them to take some risk,

Till Friday, I was thinking that 'QE Unlimited' would be a big thing but all these developments have pushed it in the background at least for India. Make no bones that QE3 will have far reaching and good/bad consequences not only for India but for the entire World in the long run but in the immediate term, I think events unfolding back home will have a much larger impact on NIFTY. I did not want to post any chart as there is hardly any change from when I last posted one but still here it is. Looking better and better.


I have given some Fibonacci levels for the correction from 6300+ levels to around 4500 level on NIFTY. We have 61.8% of this fall (which is pretty important) at around 5650 and we are about 75 points from that level. I am very much sure that this level is pretty much in sight and reach.

However, I think the Euphoria on QE3 as well as all these positive steps will take Markets up to a level which may be more than it deserves. Also we have seen some pretty impressive moves and profit taking is due and also as a consequence of rubber band effect, I expect correction in second half of the week (it may happen as early as Tuesday). I probably (if I get time) will take a contrarian view and open a small PUT position for NIFTY tomorrow at around 5645-5650 with strict stop loss of 30-40 points. Beware, sometimes I trade only on hunch.

I am back in Pune just today and was catching up on many things hence cannot write more. Have to take your leave as another week starts now and have to prepare for it. This will be a wonderful week with Ganeshotsav starting on Wednesday. I pray and hope that Lord Ganesh will bring best of health, wealth, wisdom, peace and prosperity in the lives of all readers. Happy Trading.

September 08, 2012

Fed says no QE3... Really?

I am sorry for this abstract post in between. Actually idea of this post appealed to me so much that I postponed the idea of technical tutorial post for the time being.

Last week I was listening to recent speech of Federal Reserve's Bernanke where in he was saying that he is ready to start next round of Quantitative Easing (QE) if economic conditions need it. Now as readers will recall that we have had two rounds of these QEs already where Fed has printed (not literally) more than $1.5 Trillion to infuse liquidity and stabilize the markets. Europe followed it with a fancy name of LTRO and even China also played on with some heavy infrastructure investments. (If you really want to know how much is $1 Trillion, I really recommend looking at this) This money cannot be really printed and it stays in existence only in the form of Treasury Bills which the Fed buys. One common thing about QEs in the past has been increase in price of commodities and equities that they result into. We have seen rallies in almost all asset classes every time QE has been announced with the periods of higher inflation in developing markets.

Anyways, that is not what we want to discuss here. What prompted me to write this post is my doubt about the validity of Bernanke's statement that he WILL start QE3 if needed. Now we all know that Fed is not an institute who has taken an oath of speaking truth all the time. All the data they publish has to be taken with a pinch of salt and many time their data have been published selectively, with a lag or not at all (caution: these are unsubstantiated statements... obviously). So I have my own doubts that QE3 is already in play.

Why do I say that? Just look all around us... every asset class is suddenly on fire.

1. Gold


Gold has broken out of its long consolidation and gone up by more $100 in a very short time. This is when very few analyst were expecting it. Also see the improved volume.

2. S&P 500


S&P has recently made 4 year high. Care to tell me some fundamentals reasons that may have prompted this?

3. Crude


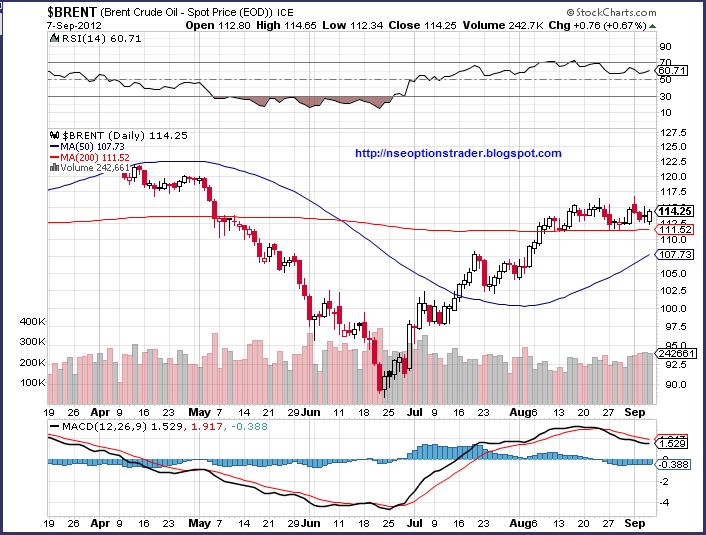
I am posting Brent Crude chart as it is more relevant to India. In spite of all issues in Europe, slowdown in China, Crude has seen some handsome rally.

Not all asset classes see positive movement with QE. Obviously if you print more dollars you will see its value going down. Let us see the Dollar Index.

4. US Dollar


Dollar which was inching up nicely till June and even in July and August suddenly lost all the steam and is now below its 200MA also.

If all this was happening in expectation of QE3, we should have seen a sharp reversal after Bernanke's statement. All these assets would have shown the shock over Feds decision not to start QE3 immediately. Did not happen...

Apart from above, just look at the interest rates, bond yields and everything seems to be supporting this hypothesis. This post is also not about discussing whether QE is a good thing or bad thing in the long term (we can have that some other time in a separate post) but what is more important is what does it mean for our markets and our trade strategies. As I had said in last few posts that I would have expected markets to go down in this week and start (slow) recovery sometime next week or so... BUT if QE3 is in play, then all our prediction go out the window.

We do not know if QE3 is actually in progress and it is just a guess. If our guess is right, then we do not know how much money is being printed, how it will be spent and how and when exactly it will be deployed. There are too many ifs and buts and in such case I advice weak hearts to stay away or bite only what you can chew. It is very difficult to predict how long and how far this rally can and will go. At most we can wait for some indecision or reversal signal. I will be on a lookout for same (not 24 hours) and will let you guys know if I find something.

I am happy to be finally able to complete this post and I can now actually look to pick up the technical tutorial post from where I left it. Hope to complete it and make it available to you guys during the weekend itself if possible. Please let me know what do you think of this abstract post and whether you will like more such posts in between.

One more thing, I just realized that this post happens to be our 100th published post. Now that is some milestone to feel good about. Honestly, I never thought that I will be able to continue to write for so long (its over a year) and will reach 100 posts someday. This is your comments that have prodded me into writing more without any doubt. Keep them coming and I will keep writing. Happy Trading.

September 02, 2012

Market Outlook

I am here again and wanted to write a tutorial before this post. Have started writing it and it should be online for you tomorrow or day after. In the meantime, in this post, I thought of taking stock of our Market and see if any trade exist for coming week. Hope you will like it.

So without wasting any time, let us see the NIFTY chart.


As you can see in the weekly chart above, NIFTY has erased the gains of previous three weeks in the past week alone. It is very frustrating for investors who see values of their picks going up inch by inch and then all of a sudden everything comes crashing down. But it was always on the cards. Right now also as you can see for NIFTY to maintain its bullish momentum the critical level is 5100 as depicted by horizontal line of low of July second week. So we may not be completely out of woods as yet.

This same support is around 5050 on daily level. See below;


RSI is not indicating any oversold condition at all and even MACD (which you will see soon in a tutorial post) is not indicating any reversal. We may not have any respite from downtrend immediately.

I was thinking of making a Straddle or Strangle or Spread trade suggestion but am seriously short of time to work it out. Have to seriously make an automatic excel based worksheet to do the calculations based on the NSE quotes exported or updated directly into it. Will take some doing but it will be a wonderful tool to help us decide things much faster. I had something similar before but it was too crude. Have to make a professional version of it. Will let you know as and when it is done and will also share it with you guys.

Right now, for trade, my thinking is like this. I expect some kind of (at least temporary) up-move on daily or intra-day basis and if I want to trade for a week, I will short the markets tomorrow (if) after they go up. Am expecting markets to maintain downtrend on weekly basis and hence expecting to square off this trade during the week sometimes.

However if I want to keep the trade till end of the series then I would like to think of markets getting back to positive territory after falling for a week or two. This is with the assumption that markets will not violate earlier low as seen above. So I would like to go long sometimes during this week or next for a trade which I want to keep till end or close to end of current series. I hope to get in around 5100 or 5050 level but I will keep position short with some serious stop-loss.

Once again, I will remind you that this blog is not intended as an investment advice for you. It is just my loud thinking about what I expect in the markets. Follow it at your own peril.

Then there is a dearth of comments from you guys. Please let me know what you think of the posts and what would you like to see my writing. It helps surely. Will be back soon with MACD. Happy Trading.

August 22, 2012

Hat-trick Post

Wow, this time around I could actually do it and I am back with my third post in three days. This goes to show that nothing is i-m-possible.

After thinking about what to write, I decided to let it flow freely without any particular agenda. So even I do not know what will come out of this but before that let us have a look at the NIFTY Chart below;


Of particular interest is the last candle on the right (candle of today). I do not know if you also see it but it appears a close 'Shooting Star' candle to me and if you have forgotten what it means, you can read it here. If true, it simply indicates that the uptrend is near an end for the time being and we may see some correction. Also, if you will notice you will also see an 'Inverted Hammer' around 25th July followed by bearish 'Marubozu' and subsequent change in trend in next couple days. Candlesticks continue to amaze me.

Usually whenever I come across something like this, I like to test my hypothesis on a larger data set. NIFTY and SENSEX with all the data in them have the limitation that they represent 50 and 30 from thousands of stocks in them. This sometimes limits the universality of our analysis. Just to weed out this factor I had a look at the NIFTY 500 chart; and behold the Shooting Star in all its glory.


Shooting Star is much more clear in case of 500 NIFTY stocks. Now this also coincides with an (over)due correction in S&P 500 of US which has defied all odds to go past 1400. It surely needs a breather. Have a look and notice that the last up move has lasted without correction a lot longer than earlier 4 cycles since June.


Almost every chart I see is calling for some correction (or at least a halt in the uptrend) but will it happen? I cannot say but all the needed signs are in place. (Cannot help but mention that; Look at the S&P500 chart and series of higher highs and higher lows since June.. classical) One more thing to note is how much the price has stretched above 50 and 200 Moving Averages. Usually prices tend to come back to MAs and larger the stretch, more violent is the retraction.

In all probability we are in for a small correction. It may be a small counter trend move as usual and may not mean much in the larger scheme of things but nevertheless it may give us some opportunity to initiate a trade.

Then, its been long since I made any philosophical post and I am feeling like giving it a shot. Stay tuned, it may be just around the corner. Right now, this post has stretched a lot so will stop now. Will be back, who knows, by tomorrow. Happy trading till then.

August 21, 2012

RSI Demystified

Here I am... as promised. After the last post and the reference to RSI, it is but natural that I talk about RSI today. It was a close call as I also wanted to discuss few individual stocks which are getting interesting but then those have to wait for another time.

Some basics before we start; In technical analysis we have indicators and oscillators. Indicators are calculated based on the price, volume, momentum, volatility, etc. They give us additional information about the price and help us in technical analysis. Indicators which vary only in a range are called oscillators and Relative Strength Index (RSI) is one of them. It tells us about the strength or weakness in the trend of the security being analysed. It is calculated as;

RSI = 100 - 100 / (1 + RS)

Where RS = Average of x days' up closes / Average of x days' down closes

Usually RSI is calculated for a period of 14 days and it is the most popular duration. So for 14 days; RS = (Sum of Gains over last 14 days/14) / (Sum of Losses over last 14 days/14)

The formula above makes sure that RSI varies between 0 and 100. However, RSI does not practically go to 0 or 100 very often. We have seen RSI in many charts so I do not need to post one to explain more.

Most important use of RSI is to confirm the trend. If you think that the security is in an uptrend, be sure to confirm that RSI is above 50. Similarly RSI below 50 acts to help us confirm the downtrend for the security. However, main question is how do we use RSI for trading? There are various ways of doing so... some of them are;
  • Overbought / Oversold conditions
  • Divergences
  • Positive / Negative Reversals
  • Failure Swings
  • Trending IDs
What we generally use is the first two. Rest of them do not occur often and are not so easy to spot. Overbought condition was already (more or less) explained in last post. Only thing to add here is it is universally accepted that RSI above 70 is overbought condition and below 30 is oversold condition.

Next, Divergence is used to identify the impending reversal in the trend of the security being analyzed. It usually happens when security makes a higher high (or higher low) but RSI fails to follow through. This is called as Bearish (negative) divergence - First rectangle in the chart below. Vice versa situation where security seems bearish but RSI is going up gives Bullish (positive) divergence and it usually signals things are about to turn positive.


My apologies for not coming up with a better graph which will give a clearer picture but I believe this one will also give the basic idea. Will not be talking about the balance 3 ways to trade RSI but will surely visit them if situation calls for.

I am happy that I was able to follow up yesterday's come back post with this small tutorial kind of post and hope that you will enjoy reading it as much as I enjoyed writing it. RSI is probably one of the most popular oscillator and it will continue to be part of our future discourse so this surely is just the beginning of it. Will think about the third post tomorrow and decide whether to write another tutorial or post some stocks specific charts. If you have any ideas, I am all ears.

 Stay tuned for my (probably) first hat-trick tomorrow. Happy Trading.

July 13, 2012

Moving Averages - Final

Finally, final post is here. Moving Averages took longer then expected but I am happy that I did not rush it through and covered all that matters. I hope that you guys are also liking it (sadly your comments or lack of them don't show that) and would be ready for such details. So let us say adios to MAs with this post.

Support and Resistance

MAs also act as Supports in an uptrend and Resistance in a downtrend. As usual short duration MA (20d) acts as Support or Resistance for Short Term trend. Long Term MA like 200D, which is most popular and widely used, acts as Support or Resistance for Long Term trend.


The chart above shows the price taking support at 200 EMA on multiple occasions. After trying three times it finally breaks the support with huge volumes and very decisively on a freak fall day. Such is the strength of 200 MA Support or Resistance. It takes some doing to break it usually.

Let us also see a case where MA line is acting as Resistance. See below;


One thing which many people tend to forget is Market do not work on logic, they work on sentiment and so one should not take Support and Resistance levels from MA lines as rigid. They should think of MA value as a region when Support (uptrend) or Resistance (downtrend) will be present. Little bit of up and down should not be considered as violation of Support or Resistance.

Conclusion

We should remember that Moving Averages are;
1. Lagging Indicators: So you will get signals after prices have already changed
2. Are ineffective in a range bound market 
3. Will not help you buy at bottom and sell at top as they tend to be followers
4. Should not be used alone (in isolation) and they must be supported by other tools / indicators

As I have repeated many times that, with me, there always is a risk of being wrong. So while following this tutorial you are requested to verify its correctness independently... that pinch of salt and all that.

Hope you have enjoyed reading about MAs as much as I have enjoyed writing about them.

Today was a difficult call as I was thinking about doing a post on Infosys / TCS saga and analyse their results. But then I had promised in the last post about finishing MAs quickly and not keep you waiting. Since the childhood I have believed that 'Promise Breaker - Shoe Maker' and honestly I don't have any aptitude in shoe making and I will really be bad at that. So I spared myself and decided for MA. Do let me know what you think though.

July 11, 2012

Moving Averages - 5

Well, the final installment is here guys. Its been almost 3 weeks since we started discussing MAs and it is hard to let go now. But as some philosopher said... life has to go on. Don't be afraid guys, I am not going anywhere. It is just that going through my earlier posts I realized that the humor factor has been absent from my writing these last few months. Effect of the load at office may be. I had become very formal in my writing and it is time that we get that 'Ting' back. So lets start from where we had left in the last post i.e. ways to trade with MAs

Double / Triple Cross-overs

Similar to Price Cross-overs we discussed in the last post, Double Cross-over refers to the cross-over between two MA lines. One of longer duration and one of shorter (obviously, same duration lines cannot cross, no?). As with everything related to MAs, duration of MA lines defines the type of trend (Short term, Medium term or Long term). To cite an example, I would say the 5D and 20D Cross-over would give a short term trend signal. 20D and 50D may be useful for Medium term and 50D with 200D MA line can be used for Long term trend change signal.

A Bullish Cross-over is said to happen when lower duration MA crosses longer duration MA line from below and goes above it. It is also called as Golden Cross. Reverse is when lower duration MA line crossed longer duration MA line from above and it is called as Death Cross.

Again this system produces a lagging signal. Here we are using two MA lines (MA individually is a lagging indicator as we discussed earlier) hence this indicator is further laggard and gives a good signal when a strong and enduring trend change takes place. Otherwise we can get lot of false triggers.


In the above NIFTY chart you will see Medium Term trend changes indicated by 20D and 50D Death Cross and Golden Cross alternatively. You will also notice that these signals appear later as compared to changes in price. One will wonder, what is the use of MAs if they are so late. Actually MAs are used in multiple ways and change in slope of MA lines gives a pretty advance indication and then you also use other indicators/ oscillators in conjunction with MAs to arrive at a trading decision. We will discuss this in details at the right time.

See another chart;


What you see above is again NIFTY chart with longer duration MA line and as you see you are getting multiple false triggers here. How do we get past these? There are two ways. First, depending on the duration of the MA lines you can give some cooling period to Cross-over e.g. for 5D, 20D lines you may decide that you will wait for 3 days after the Cross-over to confirm it. Second, as I said earlier you can use other corroborating evidence. In this case specially, you can use MACD which turns positive during Golden Cross and negative in case of Death Cross. More on this at the right time.

When you use three MA lines with lower duration MA line crossing the other two it is called as Triple Cross-over.

I thought this will be last post in MA series but looks like I will have to come back with another one for last trading strategy as this post has gone longer than I anticipated. Next trading strategy may also stretch like this so I will not take risk to start it here. Apologies guys but you will not have to wait for long, promise. Happy trading.

July 08, 2012

Moving Averages - 4

I am back with the next post in MA series. We have already seen what MAs are, types of MAs, what are the popular durations and their significance. What remains to be seen as how do we find trading signals using MAs. So lets get on with that.

There are various ways to use MAs (Simple as well as Exponential) for trading purpose. We will list them down and elaborate one by one.

1. Trend Identification
2. Price Cross-overs
3. Double/ Triple Cross-overs
4. Support and Resistance

One common thing here is that shorter the duration of MA the more volatility you will see in each of the above signals. Also short term MAs are useful for short term trends. Longer the duration, more reliable signals and they will indicates long term trends. Here MA indicates both Simple as well as Exponential MA and as I said in the last post it depends on your own comfort level. You can use anyone.

Trend Identification

The direction of the MA indicates general movement in prices. A rising MA indicates increasing price and a falling MA denotes generally decreasing price. This works well in case of medium to long duration MAs and in case of lower duration (5d, 10d) you may see too many direction changes. See the chart below;


You will see so many direction changes in 20 EMA while hardly any movement in 200 EMA. So for a short term duration, change in the direction of MA can give some signal but you need to choose duration well. A change in the direction of long duration MA signals a change in long term trend.

Here one thing to remember is MAs are lagging indicators so they will give signals when Price has already made the move and not beforehand. On a very short term basis this increases the chances of false triggers.

Price Cross-overs

MAs are used for trading signals by using Price Cross-overs where prices move above or below the MA line. So when price moves above a MA line or crosses it from below, it generates a bullish signal. Reverse is true for bearish signal when prices crosses MA line from top and goes below it.


One thing to remember here is you use this signal when long term trend is also in the direction of your trade. To cite an example, if price crosses 50 EMA from below and goes above it you would want to trade bullish but make sure that price is also above larger MA (100 or 200) in such case. Rational is that the long term trend is intact (bullish) and price came below 50 EMA as part of normal pull back and will continue to go up.

See the INFOSYS chart above where price continues to be above 200 EMA but crosses over 50 EMA few times without violating the long term trend. Gives good short to medium term gains.

Will write the final (5th) post in MA series soon. Before I sign off, have two things to share.

First, my project is officially over and I was partying in Lonavala this weekend with the office group. That place can beat any holiday destination in monsoon. Simply awesome. Enjoyed fully and hence could not write more. Second thing, one of the reader of the blog, 'Legend' send me all the posts of the blog compiled in a word file and it was very satisfying to go through everything I have written over last one year or so. Deepest thanks to Legend.

Will be back soon. Comments, as usual, will act as catalyst.