Showing posts with label Basics. Show all posts

October 01, 2012

Europe and India

Well, just like last (MACD) post, I cannot delay this one any further. I have been talking about this post for  a while now. Just like I checked few stocks of NIFTY to see any sign of stress in this rally, I wanted to check few global equations as well. Lets get on with that.

Europe

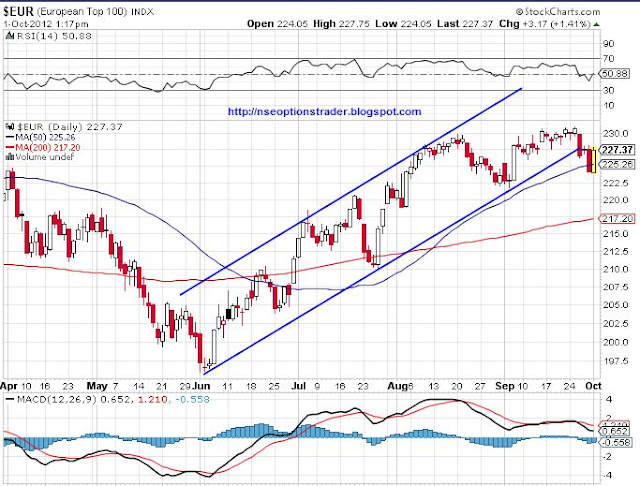
I was slightly confused about which index of Europe should I analyse; choices being German DAX, French CAC40, UK FTSE100, Spanish IBEX or Italian FTSEMI. All of them have their strong reason to warrant a look but given the dearth of time, it was impractical to post all of them. Facing probably same dilemma, some noble fellow has already invented European Top 100 index which tracks the performance of most widely traded 100 stocks across 9 European exchanges and weighed according to total Market Capitalization and Gross National Product of each country. Details of these stocks can be found here. Here is the chart.


The Index has been nicely moving up since June. It has just now broken the lower line of the channel but that may not be a decisive move. Interesting part is about its close proximity with 50 Moving Average which is at 225.26 and present level of 227.37 is tantalizingly close to it. RSI is at an extremely comfortable level but MACD is showing little drop in momentum though it is not exactly at alarming level.

Very important level to watch out here is low of first week of September which was around 222. A decisive break of that low will mean a lower low negating the present bull run for the first time since it's start. Rest of the indices in Europe are more or less having similar charts and similar predicament. A few more trading sessions should give us some more clarity and possibly very clear (and beneficial) trading opportunity. As of now, as I said, I prefer short side in the present series.

If I wait till I compare everything I want, this post would probably never happen. So I want to make few more post with title like USA and India, Commodities and India, BRIC and India (hope you get the idea) to see how do we fare so far compared to rest of the World and how much steam is left before we roll over to some correction. Hope to get some real time for that which is becoming increasingly difficult. Wish me Luck. Amen.

Happy Trading in the meanwhile.
Support and Resistance

My apologies for not making the post as promised. Having some trouble getting the global charts as I want. Nevertheless I can tell this much that last week we have formed a doji on NIFTY indicating first sign of 'halt' in this rally. Expect some sideways movement if not outright downward.

Even my Twitter handle is having some trouble tweeting a image hence posting Support and Resistance Levels for 01st October here in the blog.


There could be some issue with Java and/or flash, both of them, I updated to latest version. Will sort it out soon but I can say that if at all I am trading October series, I am trading it on short side.

Happy Trading.

September 30, 2012

MACD

MACD

Its been long time since I posted any tutorial. MACD (Moving Average Convergence-Divergence) post has been in work for past 2-3 weeks and other post took precedence due to very dynamic moves in the markets but I will feel guilty to delay it any further.

We have already seen Moving Averages which are trend following Indicators. We have seen RSI which is an Oscillator. Both have their own advantages and downside. MACD, to start with, you can say combines best of both Worlds. MACD takes two trend following Indicators (Moving Averages) and turns them into an Oscillator. MACD gives us valuable information about not only the trend but also the momentum (strength) in the direction of the change. Before deliberating further, let us see how MACD is defined and constructed.

MACD consists of three components usually defined as MACD (12, 26, 9) which is most popular combination. 12 and 26 here depicts that MACD is using Exponential Moving Average of 12 duration and 26 duration (Days, Weeks or Months) for calculating MACD Line. Third letter, 9 indicates Exponential Moving Average of MACD Line for 9 duration which is used as Signal Line. MACD Line is calculated as 12 EMA Value - 26 EMA Value and Signal Line is calculated as 9 EMA of MACD Line. Histogram that you see with MACD is the difference between MACD Line and Signal Line. The centerline around which MACD Line oscillates is also called as zero line. You can use other durations for constructing MACD depending on your time horizon and sensitivity requirements. Please see the MACD in the chart below to familiarize yourself with above terms.


Reading MACD

Let us now see how exactly we get information from MACD. As per above formula if 12 EMA (which is faster, more responsive) is higher than 26 EMA, the MACD Line is in positive territory. Positive value increases when 12 EMA is increasing at a faster speed with respect to 26 EMA which also indicates that the positive momentum is increasing. Similarly when negative value increases, it means that 12 EMA is lesser than 26 EMA and the difference is increasing indicating a stronger negative momentum. This is the most basic reading of MACD.

MACD Signals

Traders use MACD is varieties of ways to identify trading signals. Some of the popular MACD Signals are listed below;
  • Signal Line Crossovers
  • Centerline Crossovers
  • Divergence

I will make another post to explain each of the above strategy in details and with examples.

In a nutshell

MACD has the unique advantage of identifying trend as well as strength (momentum). Unlike RSI, MACD does not help in identifying overbought or oversold conditions and it does not have any upper or lower levels which limit its movement. Since MACD is a difference between two EMAs, its value depends on value of the underlying and it may totally differ for a stock worth 10 Rs or for NIFTY at 5700 level. Hence don't compare MACD of two different scripts or underlying with each other. Also, we can use different durations of EMA to change the sensitivity of MACD e.g. MACD (5, 31, 5) would be more sensitive than MACD (12, 26, 9). I prefer to go with the standard used format of (12, 26, 9). Never felt the need to try any other combo.

Now, after completing this post, I am feeling a lot better and lot lighter. Will quickly complete the follow-up post on MACD Signals with more graphs and little commentary to close this chapter. As usual, will lover to know what you think of the post so go on and let me know. Happy Trading.

September 08, 2012

Fed says no QE3... Really?

I am sorry for this abstract post in between. Actually idea of this post appealed to me so much that I postponed the idea of technical tutorial post for the time being.

Last week I was listening to recent speech of Federal Reserve's Bernanke where in he was saying that he is ready to start next round of Quantitative Easing (QE) if economic conditions need it. Now as readers will recall that we have had two rounds of these QEs already where Fed has printed (not literally) more than $1.5 Trillion to infuse liquidity and stabilize the markets. Europe followed it with a fancy name of LTRO and even China also played on with some heavy infrastructure investments. (If you really want to know how much is $1 Trillion, I really recommend looking at this) This money cannot be really printed and it stays in existence only in the form of Treasury Bills which the Fed buys. One common thing about QEs in the past has been increase in price of commodities and equities that they result into. We have seen rallies in almost all asset classes every time QE has been announced with the periods of higher inflation in developing markets.

Anyways, that is not what we want to discuss here. What prompted me to write this post is my doubt about the validity of Bernanke's statement that he WILL start QE3 if needed. Now we all know that Fed is not an institute who has taken an oath of speaking truth all the time. All the data they publish has to be taken with a pinch of salt and many time their data have been published selectively, with a lag or not at all (caution: these are unsubstantiated statements... obviously). So I have my own doubts that QE3 is already in play.

Why do I say that? Just look all around us... every asset class is suddenly on fire.

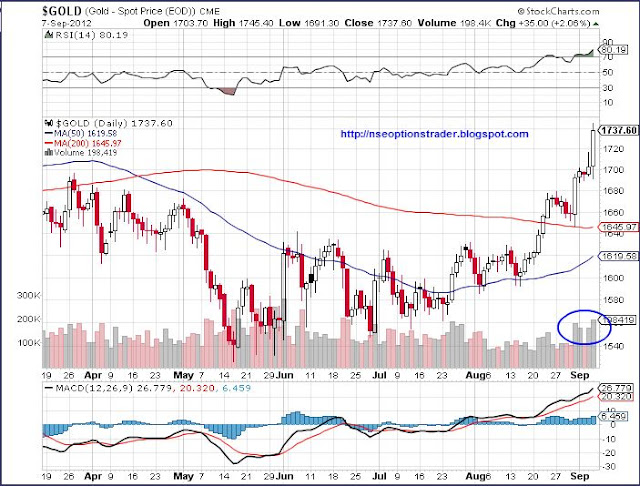
1. Gold


Gold has broken out of its long consolidation and gone up by more $100 in a very short time. This is when very few analyst were expecting it. Also see the improved volume.

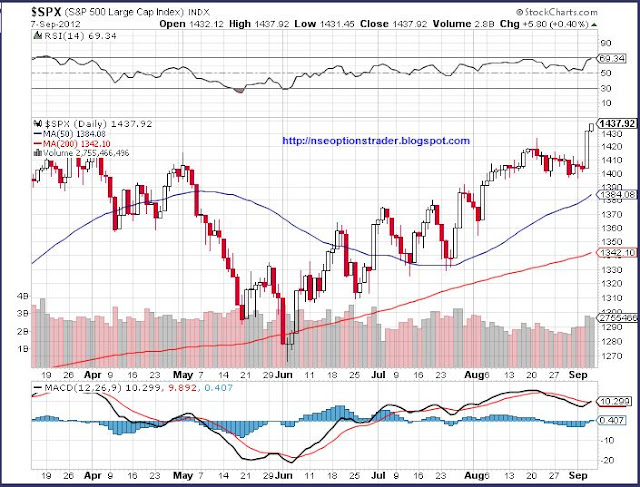
2. S&P 500


S&P has recently made 4 year high. Care to tell me some fundamentals reasons that may have prompted this?

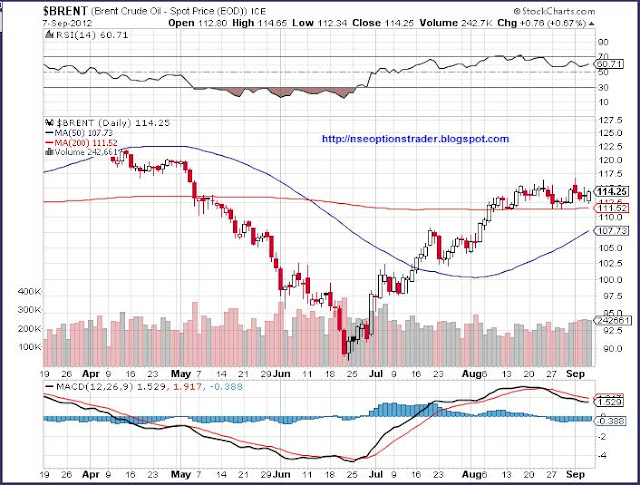
3. Crude


I am posting Brent Crude chart as it is more relevant to India. In spite of all issues in Europe, slowdown in China, Crude has seen some handsome rally.

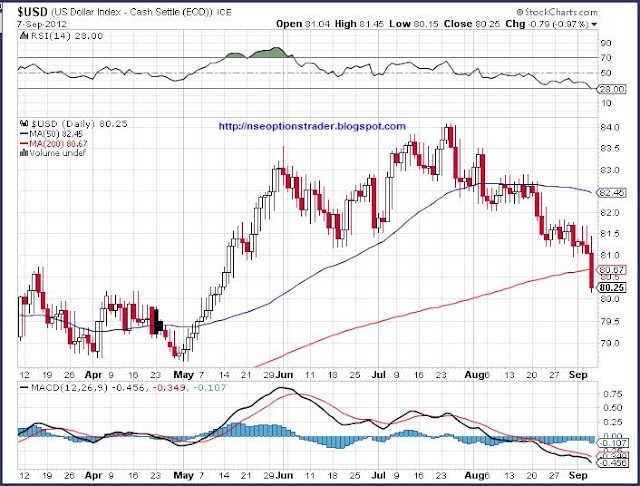
Not all asset classes see positive movement with QE. Obviously if you print more dollars you will see its value going down. Let us see the Dollar Index.

4. US Dollar


Dollar which was inching up nicely till June and even in July and August suddenly lost all the steam and is now below its 200MA also.

If all this was happening in expectation of QE3, we should have seen a sharp reversal after Bernanke's statement. All these assets would have shown the shock over Feds decision not to start QE3 immediately. Did not happen...

Apart from above, just look at the interest rates, bond yields and everything seems to be supporting this hypothesis. This post is also not about discussing whether QE is a good thing or bad thing in the long term (we can have that some other time in a separate post) but what is more important is what does it mean for our markets and our trade strategies. As I had said in last few posts that I would have expected markets to go down in this week and start (slow) recovery sometime next week or so... BUT if QE3 is in play, then all our prediction go out the window.

We do not know if QE3 is actually in progress and it is just a guess. If our guess is right, then we do not know how much money is being printed, how it will be spent and how and when exactly it will be deployed. There are too many ifs and buts and in such case I advice weak hearts to stay away or bite only what you can chew. It is very difficult to predict how long and how far this rally can and will go. At most we can wait for some indecision or reversal signal. I will be on a lookout for same (not 24 hours) and will let you guys know if I find something.

I am happy to be finally able to complete this post and I can now actually look to pick up the technical tutorial post from where I left it. Hope to complete it and make it available to you guys during the weekend itself if possible. Please let me know what do you think of this abstract post and whether you will like more such posts in between.

One more thing, I just realized that this post happens to be our 100th published post. Now that is some milestone to feel good about. Honestly, I never thought that I will be able to continue to write for so long (its over a year) and will reach 100 posts someday. This is your comments that have prodded me into writing more without any doubt. Keep them coming and I will keep writing. Happy Trading.

August 22, 2012

Hat-trick Post

Wow, this time around I could actually do it and I am back with my third post in three days. This goes to show that nothing is i-m-possible.

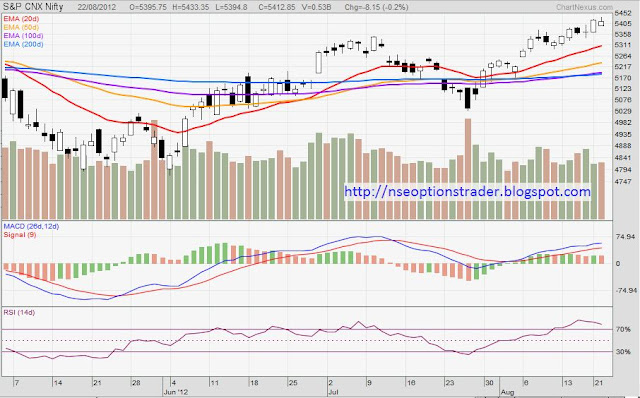
After thinking about what to write, I decided to let it flow freely without any particular agenda. So even I do not know what will come out of this but before that let us have a look at the NIFTY Chart below;


Of particular interest is the last candle on the right (candle of today). I do not know if you also see it but it appears a close 'Shooting Star' candle to me and if you have forgotten what it means, you can read it here. If true, it simply indicates that the uptrend is near an end for the time being and we may see some correction. Also, if you will notice you will also see an 'Inverted Hammer' around 25th July followed by bearish 'Marubozu' and subsequent change in trend in next couple days. Candlesticks continue to amaze me.

Usually whenever I come across something like this, I like to test my hypothesis on a larger data set. NIFTY and SENSEX with all the data in them have the limitation that they represent 50 and 30 from thousands of stocks in them. This sometimes limits the universality of our analysis. Just to weed out this factor I had a look at the NIFTY 500 chart; and behold the Shooting Star in all its glory.


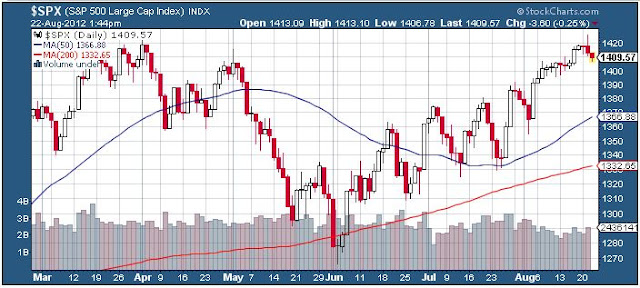
Shooting Star is much more clear in case of 500 NIFTY stocks. Now this also coincides with an (over)due correction in S&P 500 of US which has defied all odds to go past 1400. It surely needs a breather. Have a look and notice that the last up move has lasted without correction a lot longer than earlier 4 cycles since June.


Almost every chart I see is calling for some correction (or at least a halt in the uptrend) but will it happen? I cannot say but all the needed signs are in place. (Cannot help but mention that; Look at the S&P500 chart and series of higher highs and higher lows since June.. classical) One more thing to note is how much the price has stretched above 50 and 200 Moving Averages. Usually prices tend to come back to MAs and larger the stretch, more violent is the retraction.

In all probability we are in for a small correction. It may be a small counter trend move as usual and may not mean much in the larger scheme of things but nevertheless it may give us some opportunity to initiate a trade.

Then, its been long since I made any philosophical post and I am feeling like giving it a shot. Stay tuned, it may be just around the corner. Right now, this post has stretched a lot so will stop now. Will be back, who knows, by tomorrow. Happy trading till then.

August 21, 2012

RSI Demystified

Here I am... as promised. After the last post and the reference to RSI, it is but natural that I talk about RSI today. It was a close call as I also wanted to discuss few individual stocks which are getting interesting but then those have to wait for another time.

Some basics before we start; In technical analysis we have indicators and oscillators. Indicators are calculated based on the price, volume, momentum, volatility, etc. They give us additional information about the price and help us in technical analysis. Indicators which vary only in a range are called oscillators and Relative Strength Index (RSI) is one of them. It tells us about the strength or weakness in the trend of the security being analysed. It is calculated as;

RSI = 100 - 100 / (1 + RS)

Where RS = Average of x days' up closes / Average of x days' down closes

Usually RSI is calculated for a period of 14 days and it is the most popular duration. So for 14 days; RS = (Sum of Gains over last 14 days/14) / (Sum of Losses over last 14 days/14)

The formula above makes sure that RSI varies between 0 and 100. However, RSI does not practically go to 0 or 100 very often. We have seen RSI in many charts so I do not need to post one to explain more.

Most important use of RSI is to confirm the trend. If you think that the security is in an uptrend, be sure to confirm that RSI is above 50. Similarly RSI below 50 acts to help us confirm the downtrend for the security. However, main question is how do we use RSI for trading? There are various ways of doing so... some of them are;
  • Overbought / Oversold conditions
  • Divergences
  • Positive / Negative Reversals
  • Failure Swings
  • Trending IDs
What we generally use is the first two. Rest of them do not occur often and are not so easy to spot. Overbought condition was already (more or less) explained in last post. Only thing to add here is it is universally accepted that RSI above 70 is overbought condition and below 30 is oversold condition.

Next, Divergence is used to identify the impending reversal in the trend of the security being analyzed. It usually happens when security makes a higher high (or higher low) but RSI fails to follow through. This is called as Bearish (negative) divergence - First rectangle in the chart below. Vice versa situation where security seems bearish but RSI is going up gives Bullish (positive) divergence and it usually signals things are about to turn positive.


My apologies for not coming up with a better graph which will give a clearer picture but I believe this one will also give the basic idea. Will not be talking about the balance 3 ways to trade RSI but will surely visit them if situation calls for.

I am happy that I was able to follow up yesterday's come back post with this small tutorial kind of post and hope that you will enjoy reading it as much as I enjoyed writing it. RSI is probably one of the most popular oscillator and it will continue to be part of our future discourse so this surely is just the beginning of it. Will think about the third post tomorrow and decide whether to write another tutorial or post some stocks specific charts. If you have any ideas, I am all ears.

 Stay tuned for my (probably) first hat-trick tomorrow. Happy Trading.

July 29, 2012

I still hate IT Returns

And I will continue to hate IT Returns. But that is for next year, at least for this year I am through with them. It is a relief and I can say that next year it will be a cake walk unless new FM changes something and brings up new so called 'Saral' form to make returns 'Simpler'.

Then in a related development my usual charting software has gone bonkers and I was trying to get it back up online through today. Failed; so you will see a different chart today.


The chart is slightly different than usual but I am sure you will not find it difficult to read. It lacks few functionality but will make do for some time. The interesting thing to see on the chart is the close proximity of 50DMA and 200 DMA. We are inching towards a Death Cross and it can be confirmed only after it lasts for a few sessions.

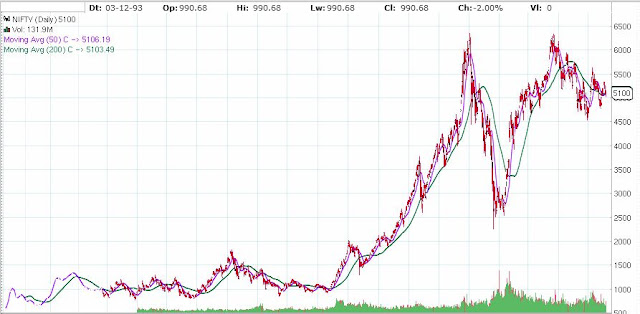
I will reiterate that in my opinion we are still in a bear market which is seeing counter trend rallies in between. Out trading horizon is usually less than 4 weeks and hence we have to mind the short as well as medium term trends and factor them in our trading decisions. It may be little difficult to believe we are in long term bear market looking at the chart above so may be our perspective will be clear if we see the chart of long term.


If you see this chart on a weekly or monthly basis things become a lot more clear. I expect some weakness in the market even in next four weeks but I am not sure about the magnitude of the move. It may not be as violent as in the last series. We may see some downward move followed by a rally and then some consolidation in the new trading range before a break out. That will be a good point for us to make some investment (not trading) decisions.

Have to study few more things in details before I can make a sound trading call. It may be simply buy/sell trade or I may work out some 'Spread' kind of trade to reduce the risk. Will try to make that post very soon but have to get some idea or some news from Europe/US to make it worthwhile.

Finally I have made up my mind regarding tutorials also so will be back with that as well. Will try to start that tomorrow itself if trading scenario is not clear. Lets hope for best. Happy trading till then.

July 24, 2012

I hate IT Returns

No kidding... the whole system of filing your IT Returns is so cumbersome that I really hate it. Primary reason for that is I have vowed not to take help of my family CA this time and decided to file it online. In the whole value chain everyone is hell bent on making your life terrible. Right from the company giving you Form 16, Banks giving you Form 16A, Broker giving you Trading Statement and P&L account... everything is so full of jargon that by the time you read them completely you have a splitting headache. It would have been so much easy to just know the amount you need to pay... pay it and sleep well. But Alas. The whole system with all (earstwhile) Saral and now ITRs is so unfriendly that you wonder whether it is made for helping residents pay tax or otherwise. The CAs are a happy lot in any case.

Ok, after this ranting, I am feeling a lot better and lighter. Now we can come back to our Blog. My apologies for taking off without any prior notice. Went to my native in Konkan for chilling out and got entangled in IT Returns after coming back. Still not over but should be done with it by tomorrow I guess.

I went through your comments and mails and can conclude that you guys want to know about RSI/MACD and Futures. I also have my own ideas but I will keep them aside for the time being and see how I can attend to your wish. I will have to make it a lot more structured this time though so it may be a couple days before I start on with tutorials again.

Meanwhile, I hope those of you who got in to 5300 PUT and some of you who preferred 5200 PUT are not disappointed. I guess you must have got good returns for your investment. This is an expiry week and though one may tend to expect volatility, the experience of last expiry was totally different. Even now, Volatility Index, VIX is at a record low and hence Option Premiums are not very high. You can have a look at it here. It is right now lower than 19 from highs of 30+. No place of high Beta stocks at the moment. Will explain this later.

At the moment, will post the NIFTY Chart before signing off. I am posting a weekly chart this time as it will help me make my point better.


As I have mentioned in earlier post that higher highs and higher lows is the first sign of Bull Market. On a weekly level we have one higher high and one higher low already. However it was in any case foolish to think that Markets are in an uptrend with all the macro-economic factors in mess, turmoil in West and a plethora of negative news from everywhere. Rightly so, we have seen Lower High and the high of June is lower than the high of Feb. Now if the Market breaches Low made in April then the picture becomes very clear. We already have all EMAs taken out by the market convincingly and MACD/ RSI are also not offering any hopes. I would bet on Markets breaching 4800 soon but you guys, hold your horses and do not rush in to trades as I need to be back this hypothesis with a better reasoning.

I will write more about it when I write the trading post for August series. Have a Happy IT Return filing till then. Have tweeted about Supports and Resistance too.

July 13, 2012

Moving Averages - Final

Finally, final post is here. Moving Averages took longer then expected but I am happy that I did not rush it through and covered all that matters. I hope that you guys are also liking it (sadly your comments or lack of them don't show that) and would be ready for such details. So let us say adios to MAs with this post.

Support and Resistance

MAs also act as Supports in an uptrend and Resistance in a downtrend. As usual short duration MA (20d) acts as Support or Resistance for Short Term trend. Long Term MA like 200D, which is most popular and widely used, acts as Support or Resistance for Long Term trend.


The chart above shows the price taking support at 200 EMA on multiple occasions. After trying three times it finally breaks the support with huge volumes and very decisively on a freak fall day. Such is the strength of 200 MA Support or Resistance. It takes some doing to break it usually.

Let us also see a case where MA line is acting as Resistance. See below;


One thing which many people tend to forget is Market do not work on logic, they work on sentiment and so one should not take Support and Resistance levels from MA lines as rigid. They should think of MA value as a region when Support (uptrend) or Resistance (downtrend) will be present. Little bit of up and down should not be considered as violation of Support or Resistance.

Conclusion

We should remember that Moving Averages are;
1. Lagging Indicators: So you will get signals after prices have already changed
2. Are ineffective in a range bound market 
3. Will not help you buy at bottom and sell at top as they tend to be followers
4. Should not be used alone (in isolation) and they must be supported by other tools / indicators

As I have repeated many times that, with me, there always is a risk of being wrong. So while following this tutorial you are requested to verify its correctness independently... that pinch of salt and all that.

Hope you have enjoyed reading about MAs as much as I have enjoyed writing about them.

Today was a difficult call as I was thinking about doing a post on Infosys / TCS saga and analyse their results. But then I had promised in the last post about finishing MAs quickly and not keep you waiting. Since the childhood I have believed that 'Promise Breaker - Shoe Maker' and honestly I don't have any aptitude in shoe making and I will really be bad at that. So I spared myself and decided for MA. Do let me know what you think though.

July 11, 2012

Moving Averages - 5

Well, the final installment is here guys. Its been almost 3 weeks since we started discussing MAs and it is hard to let go now. But as some philosopher said... life has to go on. Don't be afraid guys, I am not going anywhere. It is just that going through my earlier posts I realized that the humor factor has been absent from my writing these last few months. Effect of the load at office may be. I had become very formal in my writing and it is time that we get that 'Ting' back. So lets start from where we had left in the last post i.e. ways to trade with MAs

Double / Triple Cross-overs

Similar to Price Cross-overs we discussed in the last post, Double Cross-over refers to the cross-over between two MA lines. One of longer duration and one of shorter (obviously, same duration lines cannot cross, no?). As with everything related to MAs, duration of MA lines defines the type of trend (Short term, Medium term or Long term). To cite an example, I would say the 5D and 20D Cross-over would give a short term trend signal. 20D and 50D may be useful for Medium term and 50D with 200D MA line can be used for Long term trend change signal.

A Bullish Cross-over is said to happen when lower duration MA crosses longer duration MA line from below and goes above it. It is also called as Golden Cross. Reverse is when lower duration MA line crossed longer duration MA line from above and it is called as Death Cross.

Again this system produces a lagging signal. Here we are using two MA lines (MA individually is a lagging indicator as we discussed earlier) hence this indicator is further laggard and gives a good signal when a strong and enduring trend change takes place. Otherwise we can get lot of false triggers.


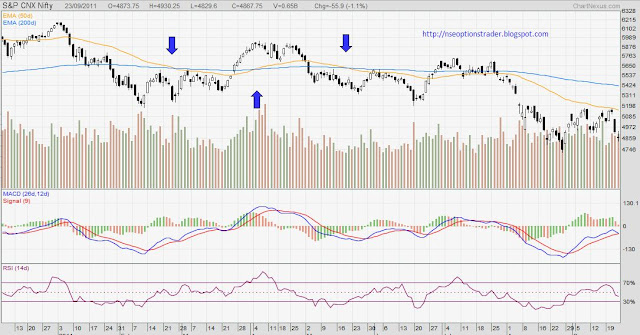
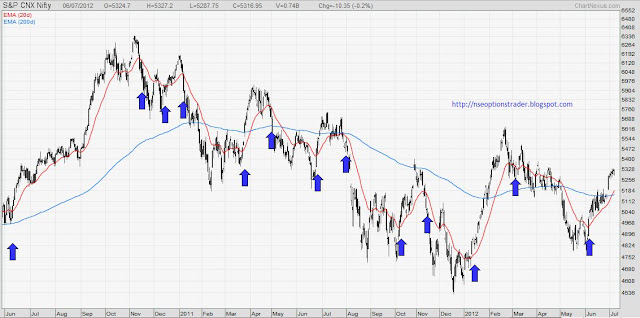
In the above NIFTY chart you will see Medium Term trend changes indicated by 20D and 50D Death Cross and Golden Cross alternatively. You will also notice that these signals appear later as compared to changes in price. One will wonder, what is the use of MAs if they are so late. Actually MAs are used in multiple ways and change in slope of MA lines gives a pretty advance indication and then you also use other indicators/ oscillators in conjunction with MAs to arrive at a trading decision. We will discuss this in details at the right time.

See another chart;


What you see above is again NIFTY chart with longer duration MA line and as you see you are getting multiple false triggers here. How do we get past these? There are two ways. First, depending on the duration of the MA lines you can give some cooling period to Cross-over e.g. for 5D, 20D lines you may decide that you will wait for 3 days after the Cross-over to confirm it. Second, as I said earlier you can use other corroborating evidence. In this case specially, you can use MACD which turns positive during Golden Cross and negative in case of Death Cross. More on this at the right time.

When you use three MA lines with lower duration MA line crossing the other two it is called as Triple Cross-over.

I thought this will be last post in MA series but looks like I will have to come back with another one for last trading strategy as this post has gone longer than I anticipated. Next trading strategy may also stretch like this so I will not take risk to start it here. Apologies guys but you will not have to wait for long, promise. Happy trading.

July 08, 2012

Moving Averages - 4

I am back with the next post in MA series. We have already seen what MAs are, types of MAs, what are the popular durations and their significance. What remains to be seen as how do we find trading signals using MAs. So lets get on with that.

There are various ways to use MAs (Simple as well as Exponential) for trading purpose. We will list them down and elaborate one by one.

1. Trend Identification
2. Price Cross-overs
3. Double/ Triple Cross-overs
4. Support and Resistance

One common thing here is that shorter the duration of MA the more volatility you will see in each of the above signals. Also short term MAs are useful for short term trends. Longer the duration, more reliable signals and they will indicates long term trends. Here MA indicates both Simple as well as Exponential MA and as I said in the last post it depends on your own comfort level. You can use anyone.

Trend Identification

The direction of the MA indicates general movement in prices. A rising MA indicates increasing price and a falling MA denotes generally decreasing price. This works well in case of medium to long duration MAs and in case of lower duration (5d, 10d) you may see too many direction changes. See the chart below;


You will see so many direction changes in 20 EMA while hardly any movement in 200 EMA. So for a short term duration, change in the direction of MA can give some signal but you need to choose duration well. A change in the direction of long duration MA signals a change in long term trend.

Here one thing to remember is MAs are lagging indicators so they will give signals when Price has already made the move and not beforehand. On a very short term basis this increases the chances of false triggers.

Price Cross-overs

MAs are used for trading signals by using Price Cross-overs where prices move above or below the MA line. So when price moves above a MA line or crosses it from below, it generates a bullish signal. Reverse is true for bearish signal when prices crosses MA line from top and goes below it.


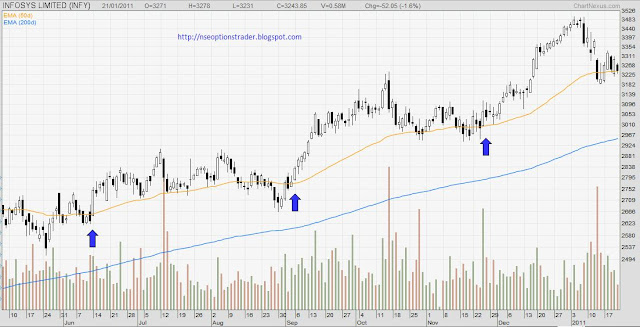
One thing to remember here is you use this signal when long term trend is also in the direction of your trade. To cite an example, if price crosses 50 EMA from below and goes above it you would want to trade bullish but make sure that price is also above larger MA (100 or 200) in such case. Rational is that the long term trend is intact (bullish) and price came below 50 EMA as part of normal pull back and will continue to go up.

See the INFOSYS chart above where price continues to be above 200 EMA but crosses over 50 EMA few times without violating the long term trend. Gives good short to medium term gains.

Will write the final (5th) post in MA series soon. Before I sign off, have two things to share.

First, my project is officially over and I was partying in Lonavala this weekend with the office group. That place can beat any holiday destination in monsoon. Simply awesome. Enjoyed fully and hence could not write more. Second thing, one of the reader of the blog, 'Legend' send me all the posts of the blog compiled in a word file and it was very satisfying to go through everything I have written over last one year or so. Deepest thanks to Legend.

Will be back soon. Comments, as usual, will act as catalyst.

June 28, 2012

Welcome New FM

I am too tired to make a long post hence resorting to something of manageable size. Moreover making trading post or last part of MA posts will need lot of writing and probably many charts and I have no energy left for that. Still I think tomorrow or day after I would be able to make part 4 of MA and then on Sunday I will make a trading post. This time, even if I do not get a clear trade, I will still post what I think will happen with the assumptions and also what risk it poses. That should qualify as trading post. Rest you guys will decide and let me know through your comments.

Today was expiry day but still the markets did not move a total of even 1% in entire day. So much for expecting volatility on expiry day. This move does not mean that everything is calm and stable. Market simply appears to be cautious ahead of the two day EU Summit that begins today in Brussels. Though one cannot be too optimistic about outcome of this summit due to opposing views of EU leaders and too many undercurrents but more and more the summit appears to be Angela Merkel (Germany) Vs the Rest of the Europe. It is correctly so because whatever the cost of saving Europe most of it has to be paid by Germans. You can read about it here.

Then as I had expected, Manmohan Singh (MMS as I call him) started acting as soon as he took charge of Finance Ministry. Though not exactly any Earth shattering announcements, he made all the right noises. However what really is encouraging is his readiness to roll back some of the archaic announcements of last General Budget. Particularly sweet sounding to the ears of FIIs will be the rollback of GAAR (General Anti Avoidance Rule) which targeted Vodafone but spooked entire FII community. I personally would have preferred if somehow Vodafone was made to pay but the cost of going after them is too much. Sometimes it is better to loose a battle if it helps us win ultimately.

Another important step could be the clarification regarding taxation on P-Notes (Participatory Notes). Rather than changing all or rolling back all these policies, if MMS can only bring clarity about them in short time, he would have started well as FM me thinks. This is one area where he is comfortable as been there done that in 1991 and I hope he weaves his magic once again. We have problems but none of them insurmountable and fortunately we have a FM at the helm who knows all too well how to do that. If he addresses policy clarity issues, he will have more air to breath while tackling structural issues.

As for the market, we are delicately balanced at 200 EMA and are free to go either way and outcome of EU summit will play a role in NIFTY direction at least in next week. Will post about that on Sunday for sure. Waiting for your comments till then. Happy trading.

June 27, 2012

Moving Averages - 3

I am back. Did not think that I will be able to write again before weekend but God has been kind. So without wasting your time, will continue our Moving Averages tutorial.

In the first two parts we have seen what are MAs and popular types among them. I will resist the urge to get in to other types of MAs as honestly that will just be a general knowledge without any practical use for trading. So as discussed, we will see which duration we should use, which type and why?

Duration:

Most simply put, duration depends on what kind of view you need about the direction of the market. In other terms, if you are looking at short term trend or you are a trader you will use MAs of lowest duration like 5 day, 10 day or 20 day. If you have a horizon of medium terms (few months) you will be more interested in 50 day kind of MA and if you are a long term investor, your choice would be like 100 day or 200 day MA.

200 day EMA is probably the most popular among all. It is a very long duration MA and usually a strong and reliable indicator of trend, change in trend. It also usually is a strong support or resistance. Medium term investor prefer 50 day MA and short term trader 5 or 10 day duration.

Short duration MAs are very agile and they adapt to price very fast. You will see a change in them even with a single day large move. Long term duration MAs are lethargic. They tend to be very smooth and usually do not get affected by short term volatility. See the self explanatory chart.


Type:

Another normal dilemma is which type of MA to use. Simple MA (SMA or DMA) or Exponential (EMA)?

To be fair, none is better than the other. EMAs give more weight-age to recent prices hence quicker to react. SMAs are simple and represent true average of period under consideration. Usually SMAs are more reliable while indicating Supports and Resistance Levels and EMAs give an early indication of change in Trend.


As you can see in above chart, 50 EMA straightens out before 50 SMA as shown in first oval. At second instance also, 50 EMA starts to drop before 50 SMA.

Here I would like to make one thing clear that one should try various duration, types of MAs depending on one's objective, time horizon, investing style and comfort level. As I have mentioned in some earlier post that I am more comfortable with EMAs, similarly you should find out your own preference.

This now leaves one last post (I am not sure if I will be able to cover everything in one post) about how to trade using MAs. I will write more than one post if it becomes too long to cover all of it in one go. Just wishing that I get the time to do so quickly.

Keep the comments flowing.

June 24, 2012

Moving Averages - 2

Lets continue our Moving forward journey. I will now site examples from the market and related fields only to make it clear.

Simple Moving Average

It is as simple as it sounds. In case of NIFTY, you take the closing values of last as many days as you are interested in, add them up and divide the total by no of days. Simple? No. Simple Moving Average.
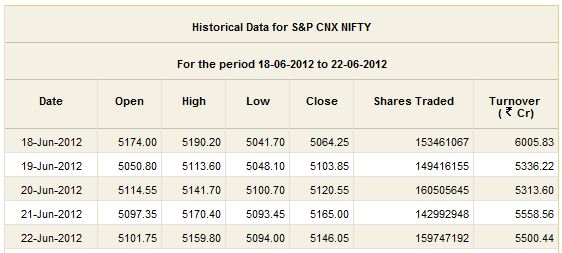
So if you take NIFTY closing of last 5 days;
5 day Simple Moving Average value would be - 5119.94. You can do it yourself. SMA is sometimes also called as DMA where D stands for days. So 5 DMA means 5 days Simple Moving Average.

Weighted Moving Average

A small discussion about Weighted MA will help us understand Exponential MAs better so here it is. In a data which runs for many months and years sometimes it is not very difficult to consider that as the reading gets older and older its importance for the present data goes on decreasing. In other terms; NIFTY closing value of 3 months back can have much less bearing on current level tomorrow when you compare with the last closing of NIFTY.

If it fits in to judgement that the more latest value the higher relevance it would have on the future value then you need to factor this in the MA calculation. This is where the Weighted Moving Average makes the entry. In WMA, the recent entries are multiplied by a factor which goes on reducing for the earlier readings and goes to 1 at the last reading. IN more simple example, for 5 day WMA you would multiply latest reading by 5, next reading by 4 then by 3 and so on. Finally you will add up everything and divide the total by 5+4+3+2+1 (total of multiplication factors). It gives you WMA. Using this method, WMA in above example it would be - 5134.92.

Exponential Moving Average

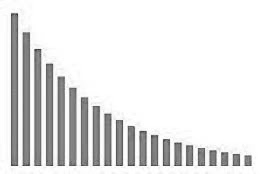
As if the WMA was not sufficient, some genius came up with the idea that the Weight of each reading should not decrease linearly. He/She thought that the latest readings should carry higher weight and it should drop faster as you go towards earlier readings. Enter the Exponential MA. So in case of EMAs the weight factor drops faster as readings grow older. Graph will give you some idea; 
It may be difficult to calculate EMA so easily but every charting tool gives you this functionality so you don't really have to get on calculator or excel to find out EMA.

Now the real question is, which one you should use and for which duration. Also how does it helps us in trading. There you go, I have my next two posts lined up here. We will see which one to use, which duration, and why in next post and then we will see how to use MAs for trading in the post after that. Let me know if you are liking it.