Lets continue our Moving forward journey. I will now site examples from the market and related fields only to make it clear.
Simple Moving Average
It is as simple as it sounds. In case of NIFTY, you take the closing values of last as many days as you are interested in, add them up and divide the total by no of days. Simple? No. Simple Moving Average.
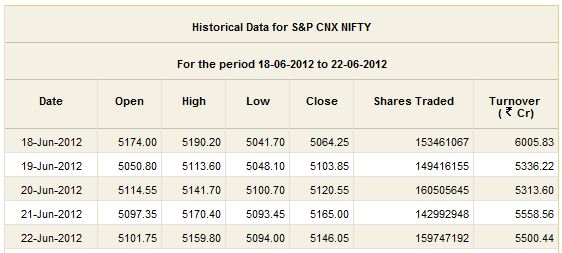
So if you take NIFTY closing of last 5 days;
5 day Simple Moving Average value would be - 5119.94. You can do it yourself. SMA is sometimes also called as DMA where D stands for days. So 5 DMA means 5 days Simple Moving Average.
Weighted Moving Average
A small discussion about Weighted MA will help us understand Exponential MAs better so here it is. In a data which runs for many months and years sometimes it is not very difficult to consider that as the reading gets older and older its importance for the present data goes on decreasing. In other terms; NIFTY closing value of 3 months back can have much less bearing on current level tomorrow when you compare with the last closing of NIFTY.
If it fits in to judgement that the more latest value the higher relevance it would have on the future value then you need to factor this in the MA calculation. This is where the Weighted Moving Average makes the entry. In WMA, the recent entries are multiplied by a factor which goes on reducing for the earlier readings and goes to 1 at the last reading. IN more simple example, for 5 day WMA you would multiply latest reading by 5, next reading by 4 then by 3 and so on. Finally you will add up everything and divide the total by 5+4+3+2+1 (total of multiplication factors). It gives you WMA. Using this method, WMA in above example it would be - 5134.92.
Exponential Moving Average
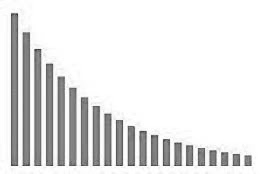
As if the WMA was not sufficient, some genius came up with the idea that the Weight of each reading should not decrease linearly. He/She thought that the latest readings should carry higher weight and it should drop faster as you go towards earlier readings. Enter the Exponential MA. So in case of EMAs the weight factor drops faster as readings grow older. Graph will give you some idea;
It may be difficult to calculate EMA so easily but every charting tool gives you this functionality so you don't really have to get on calculator or excel to find out EMA.
Now the real question is, which one you should use and for which duration. Also how does it helps us in trading. There you go, I have my next two posts lined up here. We will see which one to use, which duration, and why in next post and then we will see how to use MAs for trading in the post after that. Let me know if you are liking it.


great i know MA's now... waiting to see how to use that in trading. Pls do the next post soon... so sweet of you
ReplyDeletevery nice post dear.... pls do the next one
ReplyDeletethanks for the post didi.. algla post kab karoge
ReplyDeletethanks for the nice post ..
ReplyDelete