This post will be mostly about charts with little commentary. It will also help me regain some perspective about technicals of the NIFTY. Been writing and thinking too much about fundamentals.
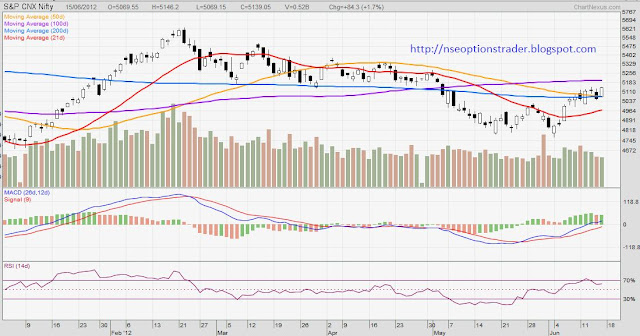
Chart 1: NIFTY with various Simple Moving Averages
Note: 50 and 200 SMAs are almost at the same level and NIFTY is resting on them from the top side. 21 and 100 SMAs are sloping up.
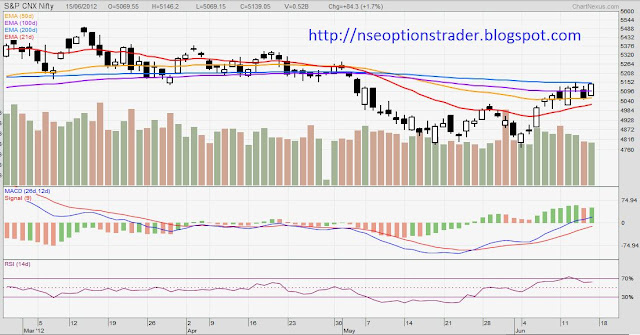
Chart 2: NIFTY with various Exponential Moving Averages
Note: I personally prefer EMAs than SMAs and I know that I need to do a post on them to explain why. These MAs will be the first when I start tutorials again. Here 21 EMA is sloping up, 50 EMA is getting flat and downward slope of 100 and 200 EMA has reduced. Note that NIFTY touched 200 EMA from bottom on Friday. 200 EMA usually is a tough cookie to crack and is a strong support or resistance.
I am studying couple more indicators and finding some very interesting stuff with Bollinger Bands. Want to include those charts here but it will get very lenghty. Will make another post with couple charts in the morning. Tomorrow I have taken a day off so it should be possible.
Thanks a lot for hanging in here. As usual, keep your comments coming in; they push me to write more.


thanks for coming back sweet heart ... was waiting for these charts and technicalss//... Please start the tutorial ..
ReplyDeletethanks for the charts buddy ..pls keep posting.. good day
ReplyDeletecharts achha lagtha hai.. kya tum daily support n resitance post karoge..
ReplyDelete