Showing posts with label Trading Strategy. Show all posts

September 19, 2012

Interesting times as usual...

Happy Ganesh Chaturthi to all my readers. May the Lord Ganesh bring happiness, health and prosperity to all of you and your families.

Well, coming back to Blog, I hate to boast but NIFTY just touched 5650 and turned back. It made a high of 5652.2 briefly on Monday and settled to 5600.05 yesterday. If you recall last post, I had hoped a return from the very same level based on plotted Fibonacci levels on the chart. Now I know the next question to your mind is how deep this correction will be? Well, the answer is not simple. Let us try to see both sides of the coin here.

First of all, I am not saying that this is correction at all. I just thought that markets will feel exhausted and run out of steam and will take a pause and it was true for markets around the World. I surely expect some more downward bias courtesy Mamata Didi. She did what she does best and put a spoke in the reform cycle. She would surely have her arguments and (misinformed) advisers to think that FDI is against farmers and 24 cylinders a year is the right amount for a poor household. Her withdrawing support to UPA when she had the option the stop FDI and increase no of cylinders in West Bengal on her own is real hypocrite behavior but it also throws up a real opportunity for UPA to get rid of her for good. She has been the main reason for delay and paralysis on reforms in UPA. Hopefully Government will survive and we will have more steps taken to revive the economy.

On the other side, I do not expect the downward move to be very steep or deep. PC has been very active in Finance Ministry since taking charge and has already made statements that more announcements are in the offing. He has virtually said that RBI will cut interest rates on October 30th (almost) as Government will be taking a lot more fiscal consolidation steps between now and then. Markets will be all ears and will be averse to go down too much anticipating some measures.

Let us see if any clue with Technicals on the chart;


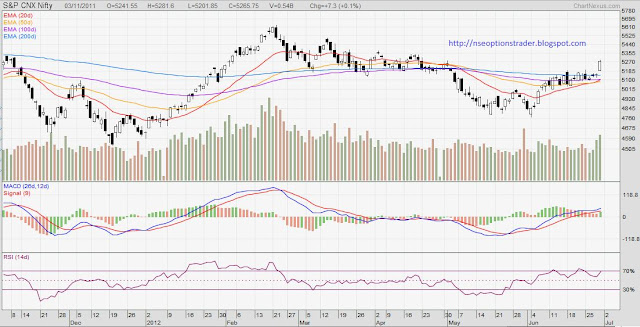
On the chart front, there is hardly any movement since I last posted expect that RSI has turned down a little on daily basis (not shown here). The trendline shown above and also the 50% retracement from Fibonacci levels in last post, both indicate a support at aroud 5430. Now that is pretty deep cut from current level of 5600 but that is a very strong support I would say for the short to medium term (till next week). I will not rule out its possibility completely as a lot will depend on not economic but political news in next few days. I will not underestimate capacity of our polity to spring few surprises. Also we will have some F5 (refresh) movement about problems in Europe and QE3 euphoria will likely take a back seat for some time at least.

Just to summarize, expect a tug of war between Bulls and Bears for some time. Expect good moves on either side and sideways movements, some consolidation (all that) till we get some more clarity about World economy and situation close home. Undoubtedly, we live in interesting times.

All in all, a very uncertain time ahead for next week and half. May Lord Ganesha, Lord of Wisdom give much needed wisdom to the people who matter and they take all the right steps. May everyone is this country and in this World benefit from these steps and lives of all the people get better and better.

Happy Trading.

September 16, 2012

Forget Fed... its all happening in India

Friday evening, Government of India made some bold announcements. There was nothing new or radical but these announcements came at a totally unexpected time and pace. Following up the Diesel hike and subsidized LPG cap, GoI cleared FDI in Retail, Aviation and Cable. Government also cleared divestment in four companies. PM statement that, 'If we have to go down, we will go down fighting' makes one think that GoI may be serious this time in pushing these steps through. Mamata tried (as usual) to play the spoil-sport by giving 72 hour ultimatum for rollback which will be ending tomorrow evening. There will be a meeting of TMC on Tuesday to decide further course of action. Been tweeting about it and I hope you guys are reading those tweets on the blog.

But focusing on the positive part as of now; what these announcements did is more than the symbolic value of their benefits (which is huge). Suddenly there is a sense of hope and a sense of purpose or direction within the UPA Government. These moves may well serve two big purpose in the immediate term. First, it may just save us from the shame of becoming the first BRIC economy to loose investment grade rating. Now this again may or may not be a big deal for India but it would have badly affected the already in trouble Private Sector. Maintenance of the rating will help Indian companies to keep cost of overseas borrowing in check (though it is already bad due to change in INR/$ equation)

Secondly, it may just give RBI some room on Monday to start thinking about cutting rates. There is more than just whispers by Pundits that RBI may continue what GoI has started. There is widespread belief that RBI may join the party and cut the rates today. If you remember the last policy statement by RBI it was clear that RBI wanted some policy actions from Government before any rate cuts. Though the Inflation (around 7.55%) is hardly anywhere near the comfort zone of RBI but slippage in growth may just prompt them to take some risk,

Till Friday, I was thinking that 'QE Unlimited' would be a big thing but all these developments have pushed it in the background at least for India. Make no bones that QE3 will have far reaching and good/bad consequences not only for India but for the entire World in the long run but in the immediate term, I think events unfolding back home will have a much larger impact on NIFTY. I did not want to post any chart as there is hardly any change from when I last posted one but still here it is. Looking better and better.


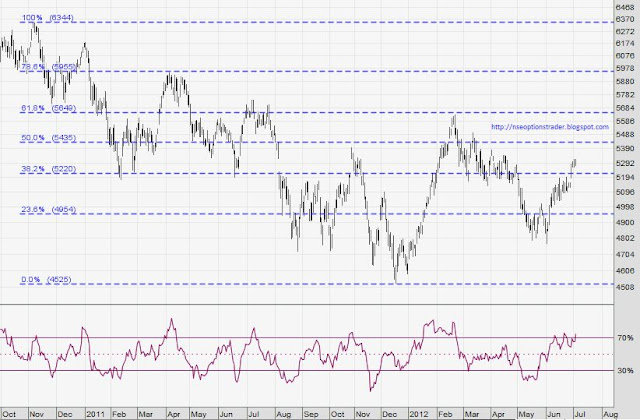
I have given some Fibonacci levels for the correction from 6300+ levels to around 4500 level on NIFTY. We have 61.8% of this fall (which is pretty important) at around 5650 and we are about 75 points from that level. I am very much sure that this level is pretty much in sight and reach.

However, I think the Euphoria on QE3 as well as all these positive steps will take Markets up to a level which may be more than it deserves. Also we have seen some pretty impressive moves and profit taking is due and also as a consequence of rubber band effect, I expect correction in second half of the week (it may happen as early as Tuesday). I probably (if I get time) will take a contrarian view and open a small PUT position for NIFTY tomorrow at around 5645-5650 with strict stop loss of 30-40 points. Beware, sometimes I trade only on hunch.

I am back in Pune just today and was catching up on many things hence cannot write more. Have to take your leave as another week starts now and have to prepare for it. This will be a wonderful week with Ganeshotsav starting on Wednesday. I pray and hope that Lord Ganesh will bring best of health, wealth, wisdom, peace and prosperity in the lives of all readers. Happy Trading.
September 02, 2012

Market Outlook

I am here again and wanted to write a tutorial before this post. Have started writing it and it should be online for you tomorrow or day after. In the meantime, in this post, I thought of taking stock of our Market and see if any trade exist for coming week. Hope you will like it.

So without wasting any time, let us see the NIFTY chart.


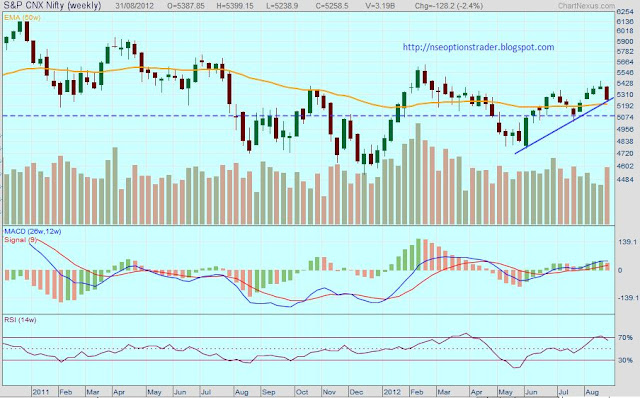
As you can see in the weekly chart above, NIFTY has erased the gains of previous three weeks in the past week alone. It is very frustrating for investors who see values of their picks going up inch by inch and then all of a sudden everything comes crashing down. But it was always on the cards. Right now also as you can see for NIFTY to maintain its bullish momentum the critical level is 5100 as depicted by horizontal line of low of July second week. So we may not be completely out of woods as yet.

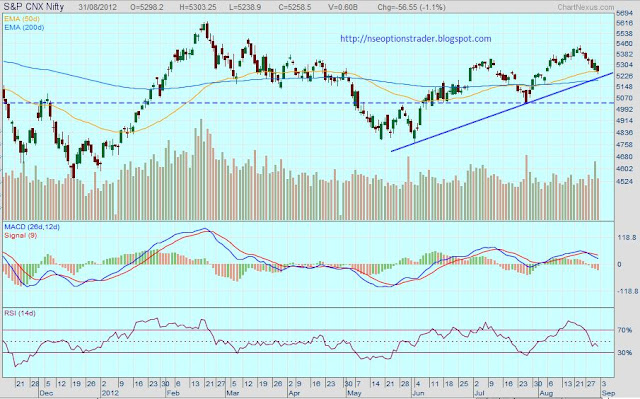
This same support is around 5050 on daily level. See below;


RSI is not indicating any oversold condition at all and even MACD (which you will see soon in a tutorial post) is not indicating any reversal. We may not have any respite from downtrend immediately.

I was thinking of making a Straddle or Strangle or Spread trade suggestion but am seriously short of time to work it out. Have to seriously make an automatic excel based worksheet to do the calculations based on the NSE quotes exported or updated directly into it. Will take some doing but it will be a wonderful tool to help us decide things much faster. I had something similar before but it was too crude. Have to make a professional version of it. Will let you know as and when it is done and will also share it with you guys.

Right now, for trade, my thinking is like this. I expect some kind of (at least temporary) up-move on daily or intra-day basis and if I want to trade for a week, I will short the markets tomorrow (if) after they go up. Am expecting markets to maintain downtrend on weekly basis and hence expecting to square off this trade during the week sometimes.

However if I want to keep the trade till end of the series then I would like to think of markets getting back to positive territory after falling for a week or two. This is with the assumption that markets will not violate earlier low as seen above. So I would like to go long sometimes during this week or next for a trade which I want to keep till end or close to end of current series. I hope to get in around 5100 or 5050 level but I will keep position short with some serious stop-loss.

Once again, I will remind you that this blog is not intended as an investment advice for you. It is just my loud thinking about what I expect in the markets. Follow it at your own peril.

Then there is a dearth of comments from you guys. Please let me know what you think of the posts and what would you like to see my writing. It helps surely. Will be back soon with MACD. Happy Trading.
August 28, 2012

Off the Track...

I thought of making a trading post but then I realised that this is the expiry week so trading post can wait for some time. We can do that for next (September) series in a couple days and we will still have ample time for trading.

As I said in last post, I have been feeling like making a philosophical post for some time now. Have so many things which create lot of thoughts in my mind like situation which is (still) unfolding in Europe, Anna's failed campaign, Blast in Pune, Coal-Gate, Maruti Violence, Apple vs Samsung, North East issues and ban on social media and so many other issues. It is commendable that an average Indian still goes about his life in usual way and does not loose sanity with so many mediocre things around us.

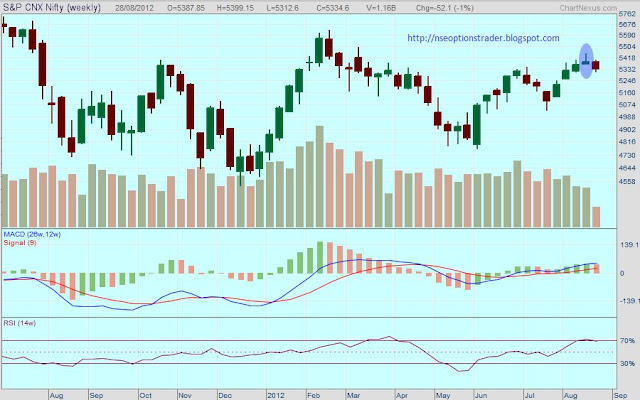
But before I go about my ranting, NIFTY weekly chart gave as clear a 'Shooting Star' as possible.


This is as clear as it gets. Though not as strong as Gravestone Doji but Shooting Star is also a trustworthy pattern in its own right. Moreover there are too many things pointing southward journey for equities in the short to medium term. If I am forced to, I am trading short. (Ignore the last candle which is for current week and it may change by Friday).

Also I wanted to write about few specific stocks if you remember. And when you talk about NIFTY you cannot escape talking about RELIANCE.


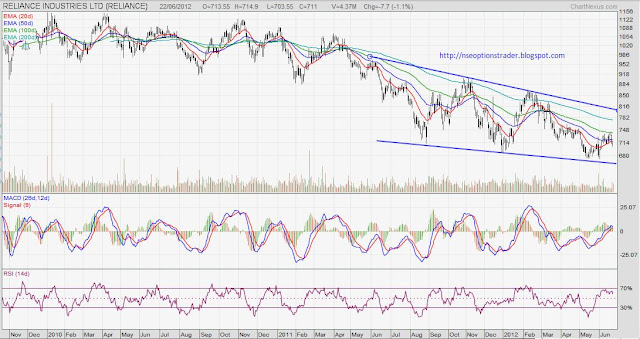
Reliance price has broken from its very long channel and is decisively above it. It has also broken its long term moving averages from below and right now comfortably above all of them. More interestingly it is all set for a Golden Cross in coming few days which may also coincide with price taking support either at 200 MA or upper line of the channel. It can see a bounce back from there. I will wait for confirmation from few more indicators and trade long if I have to without hurrying into it.

If NIFTY has to get to new highs; change in trend for Reliance is (almost) must. It has lot of weight in NIFTY and will have to turn around for NIFTY to have a reasonable chance to go up.

It took me some time between writing that first para and then posting these charts (a day in between actually, started writing this post yesterday and had to leave in between) and writing about them. Lost the steam to rant about issues mentioned. May be some other time. Hope you will like what has become of this post. Do let me know. Happy Trading.

August 21, 2012

RSI Scare

First of all, my most sincere apologies to all of you. Though I wish to... but there is no gain if I spend more time in explaining my absence. I know you are not interested in knowing those reasons behind my absence and would simply want me to get back to writing trading and tutorial posts. So will not bother you more and  get to that straight away.

I had explained some of the scenarios and their meaning in my last post which was two weeks back. Since then we have had two positive weeks and things are extremely interesting now.


We have created a new peak in last two weeks. Also we have managed three higher lows now on weekly basis. To be honest, I was not expecting the rise in last two weeks. I would have settled for rise of the first week and would have bet against the second week but then such are the markets. This week, I am definitely betting against the similar rise though we may not fall much.

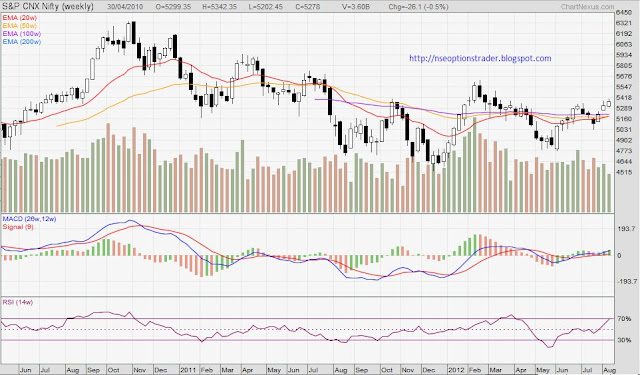
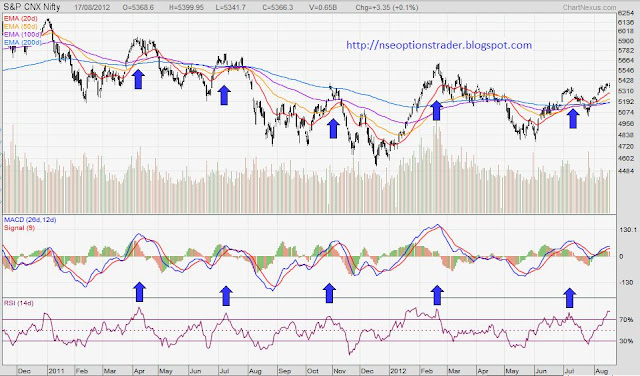
MACD is flat but RSI is nearing the overbought zone as seen above. RSI is much more overbought in daily chart. Have a look below on daily chart. Also worth noting is that RSI in overbought or oversold zone has been very reliable in last two years or so and I have marked instances of RSI overshooting the upper band and subsequent market reaction.


Presently also, as seen above, RSI is in stratosphere and that certainly is not a good sign in short term. Expect some weakness in the NIFTY this week but do not short heavily. Things often get irrational in a strongly trending market in either direction. Otherwise how would you explain last two weeks with virtually no change in fundamentals of companies, Country or World.

Then I cannot help but share good news that I have been promoted after successful completion of my last project. This development in partially responsible for my absence. However after thinking a lot about best way to apologize and make amends with all my readers, I have decided to write three posts on the trot in three days. That was the only thing which came to my mind and hope you would like it too. So I am going to go all out of my way to make sure that you have two more posts in next two days. Will also be back on Twitter in case you want those supports and resistance levels.

Needless to say, will love to hear your comments. Happy Trading.

August 05, 2012

Watta Week

A lot has happened since I made last post a week back.

There was power outages which crippled almost 600 Million people in a rising superpower country. There were blasts in my home town, Pune, in an area which can be very crowded on the eve of Rakshabandhan. There has been RBI meet in last week with only symbolic action coming through. There was a Fed meeting too not very different from RBI. Then we now officially have a drought which further threatens our already paralyzed economy. We have managed a few medals (way less than whats Phelps alone have won) in Olympics.

Let us hope this week brings us some real good news.

I have been trying to write a post every 2-3 days but things have been not working out as well so I will have to manage with what best I can do. Let us see what charts tell us for coming week.


See the weekly chart for NIFTY above. The upward pointing arrows indicate higher highs that we are getting from Jan. If we had got higher highs also, that would have meant some thing but the high of June last week was lower than the Feb and that is where this theory is weakened. Right now also, the coming week is very important and a positive week will give us at least some hope that uptrend is not ruled out completely. However a negative week will leave open the possibility that low of 2 weeks back was not the final low and we may go on to make a low which is lower than the low of June first week. This will almost completely negate the possibility of uptrend.

My reading; we are not out of the woods as yet. At the same time I am also getting a 'feeling' that we may be at the end of this long term bear correction. Usually such long term trends end in high power euphoria (bull) or high despair carnage (bears) which is yet to be seen. That is the reason I don't think we have seen the end of this downtrend. What are we waiting for? May be some kind of shock after all.

Europe, US or even China can bring about that kind of shock which can kill the sentiments and make everyone lose hope. That precisely will be the point to start investing and make merry. If we don't get such bad news from outside, may be we can make Pranab Da FM again. That will certainly qualify.

Will have to make another post soon. It is already half made and won't be long.

Happy Trading. Don't forget the comments.

July 29, 2012

I still hate IT Returns

And I will continue to hate IT Returns. But that is for next year, at least for this year I am through with them. It is a relief and I can say that next year it will be a cake walk unless new FM changes something and brings up new so called 'Saral' form to make returns 'Simpler'.

Then in a related development my usual charting software has gone bonkers and I was trying to get it back up online through today. Failed; so you will see a different chart today.


The chart is slightly different than usual but I am sure you will not find it difficult to read. It lacks few functionality but will make do for some time. The interesting thing to see on the chart is the close proximity of 50DMA and 200 DMA. We are inching towards a Death Cross and it can be confirmed only after it lasts for a few sessions.

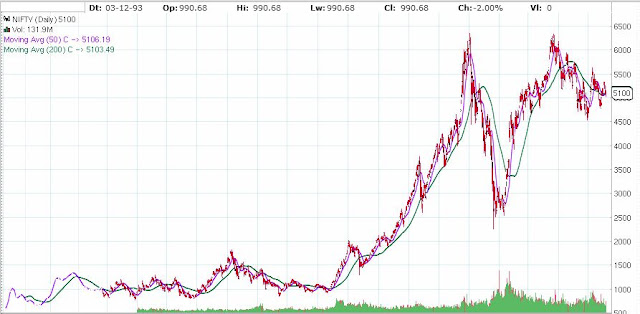
I will reiterate that in my opinion we are still in a bear market which is seeing counter trend rallies in between. Out trading horizon is usually less than 4 weeks and hence we have to mind the short as well as medium term trends and factor them in our trading decisions. It may be little difficult to believe we are in long term bear market looking at the chart above so may be our perspective will be clear if we see the chart of long term.


If you see this chart on a weekly or monthly basis things become a lot more clear. I expect some weakness in the market even in next four weeks but I am not sure about the magnitude of the move. It may not be as violent as in the last series. We may see some downward move followed by a rally and then some consolidation in the new trading range before a break out. That will be a good point for us to make some investment (not trading) decisions.

Have to study few more things in details before I can make a sound trading call. It may be simply buy/sell trade or I may work out some 'Spread' kind of trade to reduce the risk. Will try to make that post very soon but have to get some idea or some news from Europe/US to make it worthwhile.

Finally I have made up my mind regarding tutorials also so will be back with that as well. Will try to start that tomorrow itself if trading scenario is not clear. Lets hope for best. Happy trading till then.

July 13, 2012

Moving Averages - Final

Finally, final post is here. Moving Averages took longer then expected but I am happy that I did not rush it through and covered all that matters. I hope that you guys are also liking it (sadly your comments or lack of them don't show that) and would be ready for such details. So let us say adios to MAs with this post.

Support and Resistance

MAs also act as Supports in an uptrend and Resistance in a downtrend. As usual short duration MA (20d) acts as Support or Resistance for Short Term trend. Long Term MA like 200D, which is most popular and widely used, acts as Support or Resistance for Long Term trend.


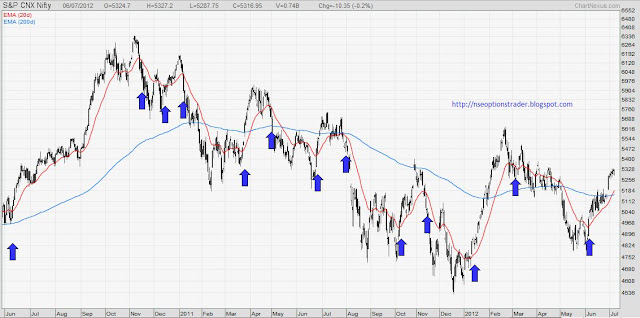
The chart above shows the price taking support at 200 EMA on multiple occasions. After trying three times it finally breaks the support with huge volumes and very decisively on a freak fall day. Such is the strength of 200 MA Support or Resistance. It takes some doing to break it usually.

Let us also see a case where MA line is acting as Resistance. See below;


One thing which many people tend to forget is Market do not work on logic, they work on sentiment and so one should not take Support and Resistance levels from MA lines as rigid. They should think of MA value as a region when Support (uptrend) or Resistance (downtrend) will be present. Little bit of up and down should not be considered as violation of Support or Resistance.

Conclusion

We should remember that Moving Averages are;
1. Lagging Indicators: So you will get signals after prices have already changed
2. Are ineffective in a range bound market 
3. Will not help you buy at bottom and sell at top as they tend to be followers
4. Should not be used alone (in isolation) and they must be supported by other tools / indicators

As I have repeated many times that, with me, there always is a risk of being wrong. So while following this tutorial you are requested to verify its correctness independently... that pinch of salt and all that.

Hope you have enjoyed reading about MAs as much as I have enjoyed writing about them.

Today was a difficult call as I was thinking about doing a post on Infosys / TCS saga and analyse their results. But then I had promised in the last post about finishing MAs quickly and not keep you waiting. Since the childhood I have believed that 'Promise Breaker - Shoe Maker' and honestly I don't have any aptitude in shoe making and I will really be bad at that. So I spared myself and decided for MA. Do let me know what you think though.

July 11, 2012

Moving Averages - 5

Well, the final installment is here guys. Its been almost 3 weeks since we started discussing MAs and it is hard to let go now. But as some philosopher said... life has to go on. Don't be afraid guys, I am not going anywhere. It is just that going through my earlier posts I realized that the humor factor has been absent from my writing these last few months. Effect of the load at office may be. I had become very formal in my writing and it is time that we get that 'Ting' back. So lets start from where we had left in the last post i.e. ways to trade with MAs

Double / Triple Cross-overs

Similar to Price Cross-overs we discussed in the last post, Double Cross-over refers to the cross-over between two MA lines. One of longer duration and one of shorter (obviously, same duration lines cannot cross, no?). As with everything related to MAs, duration of MA lines defines the type of trend (Short term, Medium term or Long term). To cite an example, I would say the 5D and 20D Cross-over would give a short term trend signal. 20D and 50D may be useful for Medium term and 50D with 200D MA line can be used for Long term trend change signal.

A Bullish Cross-over is said to happen when lower duration MA crosses longer duration MA line from below and goes above it. It is also called as Golden Cross. Reverse is when lower duration MA line crossed longer duration MA line from above and it is called as Death Cross.

Again this system produces a lagging signal. Here we are using two MA lines (MA individually is a lagging indicator as we discussed earlier) hence this indicator is further laggard and gives a good signal when a strong and enduring trend change takes place. Otherwise we can get lot of false triggers.


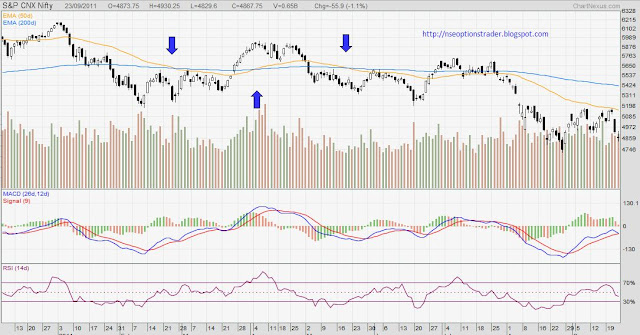
In the above NIFTY chart you will see Medium Term trend changes indicated by 20D and 50D Death Cross and Golden Cross alternatively. You will also notice that these signals appear later as compared to changes in price. One will wonder, what is the use of MAs if they are so late. Actually MAs are used in multiple ways and change in slope of MA lines gives a pretty advance indication and then you also use other indicators/ oscillators in conjunction with MAs to arrive at a trading decision. We will discuss this in details at the right time.

See another chart;


What you see above is again NIFTY chart with longer duration MA line and as you see you are getting multiple false triggers here. How do we get past these? There are two ways. First, depending on the duration of the MA lines you can give some cooling period to Cross-over e.g. for 5D, 20D lines you may decide that you will wait for 3 days after the Cross-over to confirm it. Second, as I said earlier you can use other corroborating evidence. In this case specially, you can use MACD which turns positive during Golden Cross and negative in case of Death Cross. More on this at the right time.

When you use three MA lines with lower duration MA line crossing the other two it is called as Triple Cross-over.

I thought this will be last post in MA series but looks like I will have to come back with another one for last trading strategy as this post has gone longer than I anticipated. Next trading strategy may also stretch like this so I will not take risk to start it here. Apologies guys but you will not have to wait for long, promise. Happy trading.

July 08, 2012

Moving Averages - 4

I am back with the next post in MA series. We have already seen what MAs are, types of MAs, what are the popular durations and their significance. What remains to be seen as how do we find trading signals using MAs. So lets get on with that.

There are various ways to use MAs (Simple as well as Exponential) for trading purpose. We will list them down and elaborate one by one.

1. Trend Identification
2. Price Cross-overs
3. Double/ Triple Cross-overs
4. Support and Resistance

One common thing here is that shorter the duration of MA the more volatility you will see in each of the above signals. Also short term MAs are useful for short term trends. Longer the duration, more reliable signals and they will indicates long term trends. Here MA indicates both Simple as well as Exponential MA and as I said in the last post it depends on your own comfort level. You can use anyone.

Trend Identification

The direction of the MA indicates general movement in prices. A rising MA indicates increasing price and a falling MA denotes generally decreasing price. This works well in case of medium to long duration MAs and in case of lower duration (5d, 10d) you may see too many direction changes. See the chart below;


You will see so many direction changes in 20 EMA while hardly any movement in 200 EMA. So for a short term duration, change in the direction of MA can give some signal but you need to choose duration well. A change in the direction of long duration MA signals a change in long term trend.

Here one thing to remember is MAs are lagging indicators so they will give signals when Price has already made the move and not beforehand. On a very short term basis this increases the chances of false triggers.

Price Cross-overs

MAs are used for trading signals by using Price Cross-overs where prices move above or below the MA line. So when price moves above a MA line or crosses it from below, it generates a bullish signal. Reverse is true for bearish signal when prices crosses MA line from top and goes below it.


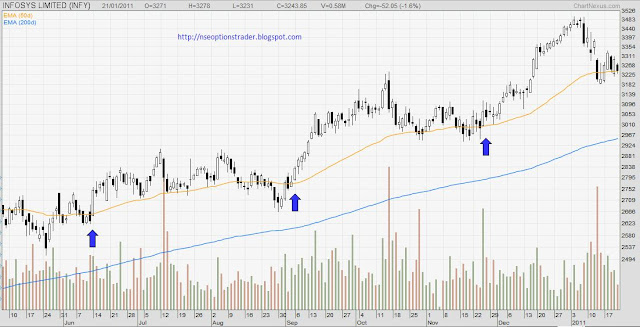
One thing to remember here is you use this signal when long term trend is also in the direction of your trade. To cite an example, if price crosses 50 EMA from below and goes above it you would want to trade bullish but make sure that price is also above larger MA (100 or 200) in such case. Rational is that the long term trend is intact (bullish) and price came below 50 EMA as part of normal pull back and will continue to go up.

See the INFOSYS chart above where price continues to be above 200 EMA but crosses over 50 EMA few times without violating the long term trend. Gives good short to medium term gains.

Will write the final (5th) post in MA series soon. Before I sign off, have two things to share.

First, my project is officially over and I was partying in Lonavala this weekend with the office group. That place can beat any holiday destination in monsoon. Simply awesome. Enjoyed fully and hence could not write more. Second thing, one of the reader of the blog, 'Legend' send me all the posts of the blog compiled in a word file and it was very satisfying to go through everything I have written over last one year or so. Deepest thanks to Legend.

Will be back soon. Comments, as usual, will act as catalyst.

July 04, 2012

So Near yet so Far

Today 5300 PUT Option Premium reached 70.20 but yet did not go below 70. I had placed an order in the morning for 70 and then did not get time to check it again. Right now I am not sure whether I should be happy or sad. Given that the US Markets are closed for Independence Day holiday and closing price of 5300 PUT around 75-76 I think we may just about get my target entry tomorrow.

However, with every passing day the probability of a upward spike in NIFTY is waning. Similarly the time remaining for NIFTY to make down move is also reducing and so is our risk.

Have a look at the chart:

If you see the peak made sometimes in Nov 2010; from then it has been a free fall with lower highs and lower lows. This is first rule of finding trend. This continued till around Dec of last year when Market was about 4500 from where it took off to above 5000. Now here Market violated  the earlier High and it went above that. After that came correction but it did not go below earlier low in May-June of this year. From there we are again going up. This picture become a lot clear if you see the weekly chart.


Fibonacci levels for this move are also plotted. Fibonacci is one of my favorite topic and I could discuss that for hours. I am really clueless how I am gonna write about it during Tutorials but it will be very interesting I am sure.

Short term view, markets are stretched above all EMA levels as well as fundamentally not much has changed to warrant this rally (apart from new FM and few positive announcements). Few broker houses have given positive reviews for India equities in recent days but that is it. Nothing has changed fundamentally for World or for India barring probably the sentiment. All in all we should see some correction. Technically I am not able to come up with any indicator which is telling me that the fall is imminent. We are hardly in overbought condition. MACD is not giving any sell signal and even Fibonacci levels are not conclusive.

In such scenario, it is worth thinking that whether we should take one sided call and buy only PUT Option betting for the fall. I probably have to study S&P 500 Index of US more closely as that is the one which affects us more directly. Will have to do a lot deeper analysis but in the meantime will stick to earlier stated position and will buy PUT call if opportunity is there. Though I may reduce the entry point (risk) a bit given the information in this post. Let me know what you think. Happy Trading.

July 01, 2012

Attempted Trading Post

Hello friends, my apologies for not being able to make post 4 of Moving Averages. Been busy this entire weekend. However I am trying to at least keep the second post promise and though I have not got sufficient time to look at the charts in details, I am just posting what I think will unravel in the July series.

What a start we had for July series on Friday. Few would have expected (including me) that markets will cheer so much the announcements from new FM. As I had mentioned in last post that MMS (ManMohan Singh) had made all the right noises and even the clarity on few announcements by PranabDa will help. Also Euro Summit happened over the weekend and though I would have loved to make a detailed post on it's outcome the time is not on my side. In a nutshell, many people think (in Europe) that out of 20 odd Europe Summits so far since the problem started, only this summit probably not only met but also exceeded the expectations. Now, me thinks, the primary reason for this is the inherently low expectations that everyone had this time. Also though Angela Merkel was vocally against shared liability of Eurozone debt, she also understands that there are not many options left. Anyways what happened in Brussels is expected to prop up the markets at least in the short term so expect another rally tomorrow.

As for the trading; I believe that though we may see the rally in equities to continue, it may be short lived. If I have to trade, I would probably wait for the market to go up tomorrow and would like to bet on to a correction. This definitely carries a risk that market may continue to go up. It also carries the risk that the correction may not happen in time for July series.


The best way to cut risk is to buy a PUT Option at 5300 or 5400 Strike if you agree with my thinking. Right now 5300 Put Option is around 105 Rs and 5400 Put Option is around 160. I will probably wait for markets to gain tomorrow so that these prices drop and depending on the level of the markets and price of these two Option will do a quick break-even calculations and based on my risk appetite get in to one of them. Needless to say Options is a risky business and will not play it beyond my risk money.

Please note that this is not a investment or trading advice. It is only my personal thought process on what I would do if I trade tomorrow. I have been wrong more often than not and lost money. Please do not treat this as an advice and do not blame me for your decisions.

Finally, I would like to say that I am really really disappointed that no comments on my earlier post. Probably that is also one of the reason I could not write MA post 4. So this time do not let me down and let me know what you think of this post. Also its been long that I took any feedback from you guys so it would be great if you can let me know if you want any changes in the way this blog is shaping up. Will be waiting for your suggestions. Happy trading.

Disclosure: Been very busy so may not get time to trade at all. Right now I do not have any trading positions open.

June 24, 2012

Charts

As promised I had started preparing for trading post but could not find a clear cut trade for the week. There were too many uncertainties and assumptions which were greatly diminishing the risk to reward ratio. I though after so many days if I am doing any trading post, I should be slightly more convincing. Another factor is this being expiry week, volatility may be little high for our comfort. So I decided against writing the trading post.

However, I did not want to go back to continuing MA post and was in mood to post some charts anyway. So I decided to improvise the trading post a little. Here I am posting charts of some very popular NIFTY components. Again the commentary is minimum.

Reliance:


You simply cannot skip RIL when talking about NIFTY. This stock used to be the single biggest factor in deciding NIFTY direction not long ago. However presently there is not much to say here. As you can see the stock is in clear downtrend in the channel. The channel has just intensified and this in spite the fact that there is an active buy back is in the progress. It was never my favorite and certainly isn't one right now.

State Bank of India:


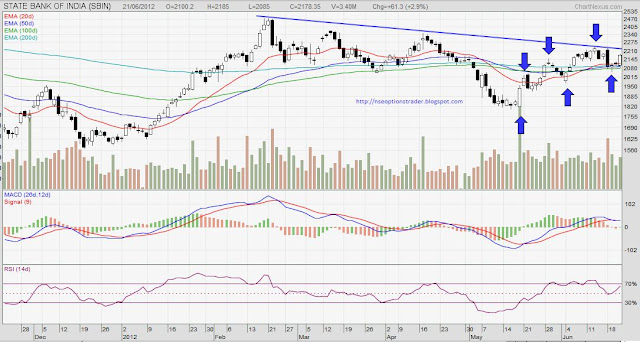
This is the Indian bellwether of probably the most important sector in the World right now... Banking. This stock is a direct barometer of health of Indian Banking system though sometimes it has to bear the brunt of being a Public Sector Bank. As you can see, recently as a very short term level it has started creating higher highs and higher lows (This is the first principle of checking uptrend). But this is very short term and there is a strong resistance at the top marked by the trend line. Unless it decisively breaks that, I wouldn't go long in a hurry. In any case, Banking sector as a whole has just too many uncertainties these days and it is affected not only by RBI but ECB/FED and bond yields of even tiniest European countries. Only a brave heart will take a long term position here.

ITC:


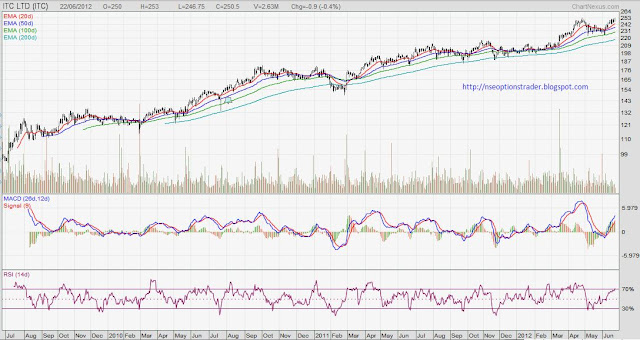
Isn't it a beautiful chart. Has been going up consistently in spite of increased taxes on Tobacco items. ITC actually is a very diversified company from Hotels, FMCG to what not and it is very very difficult to find the fair value of this stock by fundamental method. Though the slope of the rise is not extraordinary the consistency of the rise in a volatile market is worth a note. It is just about to approach over bought condition and might see a piddly correction. This stock is for someone who is an investor and less for a trader.

Hope you will excuse me for not making a trading post and have enjoyed the charts here. Will get moving with the next post on Moving Averages and will also keep my eyes open for any suitable trading post. Keep the comments coming, they help me get back to writing.

Disclosure: No live trading position in any of the above stocks. Have a small no of RIL shares which are held since few years without any short term interest.

June 21, 2012

Tutorial Post

Guys, finally, I have managed to make our continuation post on Technical Tutorial. As earlier I have made this post on Equity Blog. You can read it here.

As usual I will wait for your comments and thoughts.

Giving everything to make a trading post possible by weekend. Wish me luck.


June 17, 2012

NIFTY Charts

This post will be mostly about charts with little commentary. It will also help me regain some perspective about technicals of the NIFTY. Been writing and thinking too much about fundamentals.

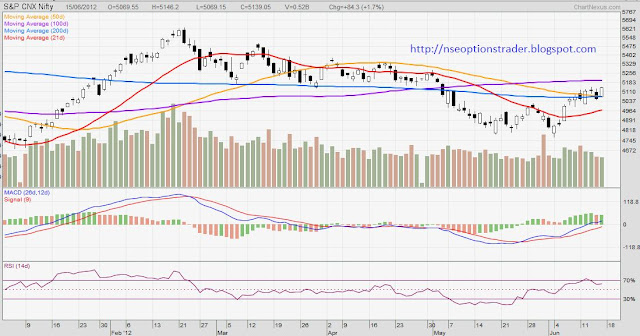
Chart 1: NIFTY with various Simple Moving Averages


Note: 50 and 200 SMAs are almost at the same level and NIFTY is resting on them from the top side. 21 and 100 SMAs are sloping up.

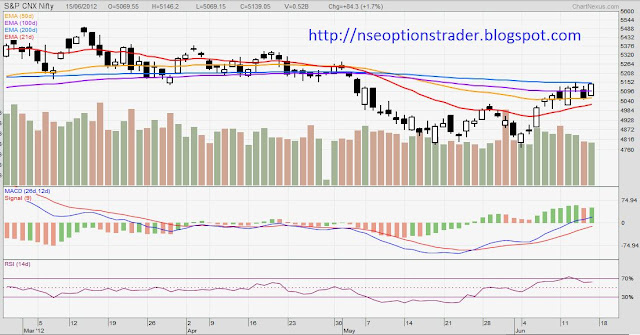
Chart 2: NIFTY with various Exponential Moving Averages


Note: I personally prefer EMAs than SMAs and I know that I need to do a post on them to explain why. These MAs will be the first when I start tutorials again. Here 21 EMA is sloping up, 50 EMA is getting flat and downward slope of 100 and 200 EMA has reduced. Note that NIFTY touched 200 EMA from bottom on Friday. 200 EMA usually is a tough cookie to crack and is a strong support or resistance.

I am studying couple more indicators and finding some very interesting stuff with Bollinger Bands. Want to include those charts here but it will get very lenghty. Will make another post with couple charts in the morning. Tomorrow I have taken a day off so it should be possible.

Thanks a lot for hanging in here. As usual, keep your comments coming in; they push me to write more.

March 15, 2012

Budget Tomorrow

Finally the D-day is here. All preparations have been done and the great General Budget Circus will play out tomorrow. Hope it does not create a storm the way Rail Budget did which you would know if you are not in the jungles of Amazon... As I said, Mr. Trivedi has definitely appealed to a rational mind. His new statement that he does not want Indian Railways to go Air India way speaks a lot about how practical and pragmatic this fellow is. There are not many people who would understand, care to admit and defy someone like Mamata for this. He is definitely a 'like' on FB from me.

Coming back to General Budget, then today's Economic Survey had all the predictable information and hardly anything new was mentioned. It is hopeful that Growth will pick up and rates will drop. Zee News gave good summary of Economic Survey highlights and it can be seen here.
Disclaimer: I am not related to Zee News and I gave the link just because I liked it.

On the sidelines, RBI's monetary policy meeting too ended without any action (a.k.a. rate cut) however the statement made by them raises the hope that there can be a rate cut when they meet again in April. That will be a good move for economy as well as for home loan holders (I included). Present high bond yields are a deterrent in the form of high borrowing cost for everyone and it needs to come down.

As for the budget tomorrow... Fiscal Deficit Target of 4.6% seems like stuff of dreams as of now and it will be violated by a wide margin. Situation is not expected to improve with Brent Crude near $125 and Rupee at 50 vs Dollar. Various commodities (of which we import a lot) are also getting dearer. 2G Spectrum sales may bring some respite and additional much needed mullah for Government in next fiscal. Still the target deficit in next fiscal may not be less than 5%.

Economic Survey showered lot of praise on Services Sector and there are chances that it may see some positives. Increase in Import Duty for some goods is also on cards particularly for our imports from China. That may be good news for domestic Telecom and Power companies. However, the largest beneficiary of this budget may actually be the common man for a change. With the drubbing that Congress got in latest elections, it may try to woo back it's middle class vote bank through budget. Specifically because of this reason, there may be some stupid populist move in budget which may put off the market. Abolishing STT (highly unlikely) is the kind of move which can really propel markets to upside.

Lets see if NIFTY Chart gives any clue...


NIFTY is at 21EMA and I feel that we may see a bounce back tomorrow. As for trading, I will prefer if you revisit the Straddle and Strangle Posts before deciding anything.

NIFTY 5400 Call is at 118 and 5200 Put is at 42. This Strangle will have upper break-even at 5560 and lower break-even at 5040 level of NIFTY if you carry them till expiry. Now I don't expect we will see these levels immediately but booking half of the gain of one of the position tomorrow itself during the day can be a good strategy. I mean to say that if you enter in to this (or similar) Strangle tomorrow morning and then during budget book profits partially on one of the position to cover most of your costs could be one way of trading budget (I am kicking myself for not making this post yesterday so that we could have entered today itself). E.g. if NIFTYgoes up by a modest 50 points and Call Option Premium is now at a level which also covers your Put Option Premium, you can square off half of your position to recover your monies and let the remaining position wait for a suitable time before expiry. I am asking you to book some profit because Budget moves can be real ephemeral and gains can be made or lost quickly and as usual I like to play safe.

Will post tomorrow during trading hours if something worth mentioning comes up. Wish you good luck for tomorrow and have a happy budget. Happy Trading goes without saying.