And I will continue to hate IT Returns. But that is for next year, at least for this year I am through with them. It is a relief and I can say that next year it will be a cake walk unless new FM changes something and brings up new so called 'Saral' form to make returns 'Simpler'.
Then in a related development my usual charting software has gone bonkers and I was trying to get it back up online through today. Failed; so you will see a different chart today.

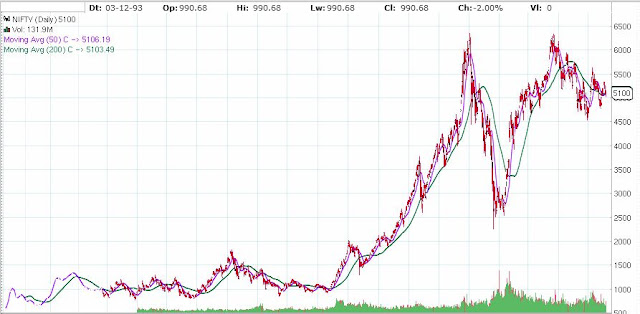
The chart is slightly different than usual but I am sure you will not find it difficult to read. It lacks few functionality but will make do for some time. The interesting thing to see on the chart is the close proximity of 50DMA and 200 DMA. We are inching towards a Death Cross and it can be confirmed only after it lasts for a few sessions.
I will reiterate that in my opinion we are still in a bear market which is seeing counter trend rallies in between. Out trading horizon is usually less than 4 weeks and hence we have to mind the short as well as medium term trends and factor them in our trading decisions. It may be little difficult to believe we are in long term bear market looking at the chart above so may be our perspective will be clear if we see the chart of long term.
If you see this chart on a weekly or monthly basis things become a lot more clear. I expect some weakness in the market even in next four weeks but I am not sure about the magnitude of the move. It may not be as violent as in the last series. We may see some downward move followed by a rally and then some consolidation in the new trading range before a break out. That will be a good point for us to make some investment (not trading) decisions.
Have to study few more things in details before I can make a sound trading call. It may be simply buy/sell trade or I may work out some 'Spread' kind of trade to reduce the risk. Will try to make that post very soon but have to get some idea or some news from Europe/US to make it worthwhile.
Finally I have made up my mind regarding tutorials also so will be back with that as well. Will try to start that tomorrow itself if trading scenario is not clear. Lets hope for best. Happy trading till then.

nice post... thnx... awaiting the trade calls and tutoriAL
ReplyDeletegreatttt excited to see ur tutorial
ReplyDeletestart the tutorial dear
ReplyDeleteIf you observe you would notice that the slope of the moving averages are flattish towards the right end of the chart indicating a lack of a clear trend. Moving averages (and most technical indicators) dont work that well in trendless periods and hence a death/golden cross shouldn't be given that much importance.
ReplyDeleteThe thing that actually worries me is the validity of the newly emerged uptrend. While we made an initial higher high and higher low on the weekly, it quickly changed to a lower high and a higher low, thereby weakening the strength of the uptrend. Lets see how things pan out.
All in all, a good article. Keep it up.
Very true.
ReplyDeleteOn a weekly chart, higher high and higher low is followed by lower high and higher low. In fact this coming week is very crucial to test the validity of uptrend. I am working on next post and will have this chart in there.
Thanks for your comments.