I am back with the next post in MA series. We have already seen what MAs are, types of MAs, what are the popular durations and their significance. What remains to be seen as how do we find trading signals using MAs. So lets get on with that.
There are various ways to use MAs (Simple as well as Exponential) for trading purpose. We will list them down and elaborate one by one.
1. Trend Identification
2. Price Cross-overs
3. Double/ Triple Cross-overs
4. Support and Resistance
One common thing here is that shorter the duration of MA the more volatility you will see in each of the above signals. Also short term MAs are useful for short term trends. Longer the duration, more reliable signals and they will indicates long term trends. Here MA indicates both Simple as well as Exponential MA and as I said in the last post it depends on your own comfort level. You can use anyone.
Trend Identification
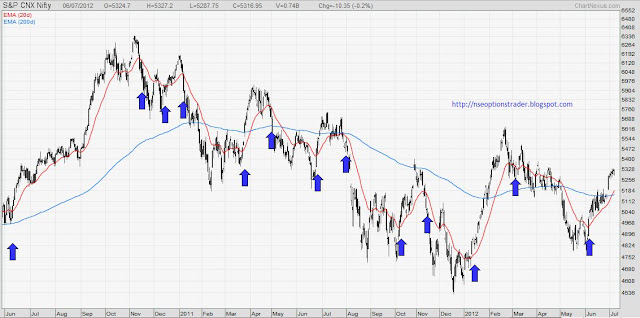
The direction of the MA indicates general movement in prices. A rising MA indicates increasing price and a falling MA denotes generally decreasing price. This works well in case of medium to long duration MAs and in case of lower duration (5d, 10d) you may see too many direction changes. See the chart below;
You will see so many direction changes in 20 EMA while hardly any movement in 200 EMA. So for a short term duration, change in the direction of MA can give some signal but you need to choose duration well. A change in the direction of long duration MA signals a change in long term trend.
Here one thing to remember is MAs are lagging indicators so they will give signals when Price has already made the move and not beforehand. On a very short term basis this increases the chances of false triggers.
Price Cross-overs
MAs are used for trading signals by using Price Cross-overs where prices move above or below the MA line. So when price moves above a MA line or crosses it from below, it generates a bullish signal. Reverse is true for bearish signal when prices crosses MA line from top and goes below it.
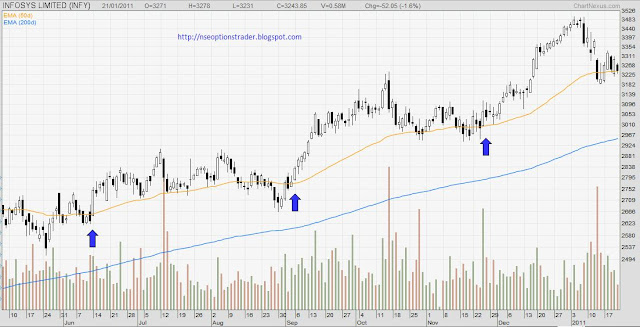
One thing to remember here is you use this signal when long term trend is also in the direction of your trade. To cite an example, if price crosses 50 EMA from below and goes above it you would want to trade bullish but make sure that price is also above larger MA (100 or 200) in such case. Rational is that the long term trend is intact (bullish) and price came below 50 EMA as part of normal pull back and will continue to go up.
See the INFOSYS chart above where price continues to be above 200 EMA but crosses over 50 EMA few times without violating the long term trend. Gives good short to medium term gains.
Will write the final (5th) post in MA series soon. Before I sign off, have two things to share.
First, my project is officially over and I was partying in Lonavala this weekend with the office group. That place can beat any holiday destination in monsoon. Simply awesome. Enjoyed fully and hence could not write more. Second thing, one of the reader of the blog, 'Legend' send me all the posts of the blog compiled in a word file and it was very satisfying to go through everything I have written over last one year or so. Deepest thanks to Legend.
Will be back soon. Comments, as usual, will act as catalyst.


didi nice post... also nice theme...
ReplyDeletethanks for the nice explanation..waiting for the next post
ReplyDeleteThanks buddyyy
ReplyDeletenice article madammm.... pls do the next one
ReplyDeletergds