December 11, 2011

Trading Strategy - Butterfly Spreads

The last post on Trading Strategy was related to Spreads. You will remember well that it was a Limited Risk, Limited Profit Strategy. I also explained that there are Bull Call Spreads, Bear Call Spreads, etc. While most of them are obvious to you once you are aware of one... Butterfly Spread Strategy is an interesting mixture which I promised that I will cover in a post. Today is the day.

Butterfly Spread is a mixture of Bull Spread and Bear Spread and it consists of three Strike Prices. It is a Neutral Strategy which is again Limited Risk and Limited Profit play. It is usually employed when you think that the stock/index will not move much till the next expiry (low volatility). It is slightly tricky to explain theoretically hence lets use an example.

Let's say NIFTY is at 4800 and you expect it to stay there till the expiry of current cycle without much movement on either side. In such case you enter following trades (all Premium values are close to actual with little bit rounding off);
  • You buy one In the Money (ITM) Call of 4600 at 225Rs - Premium paid 11250/-
  • You sell two At the Money (ATM) Calls of 4800 at 100 Rs each - Premium received 10000/-
  • You buy one Out of the Money (OTM) Call of 5000 at 35 Rs - Premium paid 1750/-
(I am not considering trading charges here. Please read earlier posts in case you are not following Premium calculations or Options Terminologies here.)

Below graph shows how will we fare with respect to NIFTY movement.


As you can see above, the maximum you loose is difference between the Premiums paid and received. So;

Maximum Loss = Net Premium Paid (60 Rs in this case) and it occurs when;
NIFTY is either lower (or equal) to Lower Strike or higher (or equal) to Higher Strike.

Maximum Profit = (Diff between Strike Price of Short Call and Lower Strike) - Net Premium
It occurs when; NIFTY = Strike Price of Short Call

So Maximum Profit = (4800-4600=200)-(60) = 140 Rs at 4800 NIFTY

Lower Break-even = Lower Strike Price + Net Premium = 4600+60 = 4660
Upper Break-even = Higher Strike Price - Net Premium = 5000-60 = 4940
This is the zone between which you make money.

So you are risking 60 Rs (60x50 = 3000 Rs) for a potential gain of 140 Rs (140x50 = 7000 Rs). However, note that this strategy is useful in sideways market. In a strong trending or volatile market, you will loose money more often than gaining.

The middle Strike is called as Body and two Strikes on either side are called as Wings. Now you can guess why the name Butterfly for this one. For once it makes sense. Another interesting derivation of this Strategy is when the Center Strike Price is not single one but two... means rather than shorting two Calls of one single Strike, you short one Call each of two close Strike Price in the Center. This is called as Iron Condor and you can read more about it here. Rather than a pointed cliff in above graph, it has a graph which resembles a flat top between two Center Strikes. Do let me know in case you want more on it. Until next post.

Happy Trading.

Note: My apologies for some mismatch in example and figures on the chart (only legends). Will correct them in the evening as I do not have access to it right now. Meanwhile you can read 4700 as 4600, 4900 as 4800 and 5100 as 5000 in the legends area. Chart otherwise is okay.

December 08, 2011

Update

I am feeling a lot better. In my last post I forgot to mention that sometimes last week I had managed to buy NIFTY 4700 PUT under 40 (all inclusive). It was a very small contrarian (opposite to majority) move which as I had mentioned I entered for the heck of it. I had this feeling that I will not lose money on it. It is not just gut feeling but the knowledge that there is more pain in the market. Today I exited it at a small profit deciding not to push my luck too far. Needless to say, I squared off without looking at the charts and finding about what is happening in Europe and America. Looking at the US Markets, I am getting the feeling that I hurried into it.

Well, no fun in crying over split milk... Market will be there tomorrow and so will be new trades and new money to be made. Looking at the chart below, it looks like that there will be a short term break at the NIFTY party and we may see some down moves now.


I, personally, am still a fan of the secret society who believes that NIFTY will touch 4700 at least once more. Tricky part is the prediction about the time. With some conviction I would like to say that it will happen before next months series ends. That also reminds me of my recent theory that 2012 (World may not end in it as shown in the painful movie) could be the worst (or at least one of the worst) year for the equities. I will make a separate post on why I think so.

Haven't looked at all the indicators in detail and hence not posting a trade right now but will definitely do that over the weekend and post something. Needless to say that I have been wrong earlier with both; my trades based on charts and also based on my beliefs/theories and I am proud about that. It only shows that I am just a human being; my falling sick also shows that on some other platform but that is now what I am talking here.

Until next post.

December 06, 2011

Markets this Week

Hi guys, I am back again. For those of you, who don't know, I was not feeling well and was slipping in and out of consciousness for last three days. It all started with the weekend exertion and manifested itself in to a full blown thing which culminated in me being stuck with bed all the time. Much needed rest I guess.

Not that I could have written much even otherwise. Markets continue to be unpredictable (what else was I expecting?) and no clear sign of resuming downtrend still. Yesterday Market formed a Doji indicating some indecision but as I explained on Doji Post on Equity Blog it does not mean much apart from indicating even honors for Bulls and Bears.

Looking at the Asian, European markets today and present state of US Markets I guess we may have a slightly negative opening tomorrow (off course unless US Markets spring a surprise in the later half). Important levels for tomorrow;

Support 1: 5010
Support 2: 4980

Resistance 1: 5062
Resistance 2: 5085

Some Explanation of these levels can be seen here.

Posting a chart indicating these levels. Click on it if you want to see the larger picture (pun intended).


Happy Trading.

December 02, 2011

Market this Week

The markets did manufacture a good turn around thanks to support from West. The idea of all large Central Banks coming together to loosen their purse strings in tandem is... to be honest... scary. It may help stock markets all over but watch out for commodities as well. May not be a good thing for developing economies which are fighting high inflation.

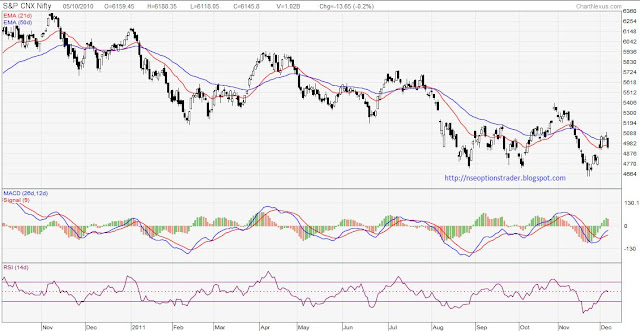
Anyway, coming back to NIFTY. See the chart below.


Market is clearly trying to get back to the upper end of the channel which lies somewhere over 5300... a long shot I would say. MACD and RSI both are in supportive mood though I have to admit. Today market has taken a support at the 21 day EMA which is at 4938 and the next immediate resistance is somewhere at 5018 which is 50 day EMA for the NIFTY.

I wanted to get in to the Trade with a 4700 PUT today but could not do so in time. Today Europe were down by up to 1% while US was half a percent down when I last checked before going to bed. If markets are in positive territory again, will get a micro PUT trade just for the heck of it.

Hope to have a more definitive trade for the coming week.
Happy Trading till then.

December 01, 2011

Market Today

Get ready for a bumper opening of at least 120-150 points. No definitive trade for this week from my side... Was cooling off.

Happy Trading.

Disclosure: Might buy a micro position on short side... May be a 4700 PUT.