December 11, 2011

Trading Strategy - Butterfly Spreads

The last post on Trading Strategy was related to Spreads. You will remember well that it was a Limited Risk, Limited Profit Strategy. I also explained that there are Bull Call Spreads, Bear Call Spreads, etc. While most of them are obvious to you once you are aware of one... Butterfly Spread Strategy is an interesting mixture which I promised that I will cover in a post. Today is the day.

Butterfly Spread is a mixture of Bull Spread and Bear Spread and it consists of three Strike Prices. It is a Neutral Strategy which is again Limited Risk and Limited Profit play. It is usually employed when you think that the stock/index will not move much till the next expiry (low volatility). It is slightly tricky to explain theoretically hence lets use an example.

Let's say NIFTY is at 4800 and you expect it to stay there till the expiry of current cycle without much movement on either side. In such case you enter following trades (all Premium values are close to actual with little bit rounding off);
  • You buy one In the Money (ITM) Call of 4600 at 225Rs - Premium paid 11250/-
  • You sell two At the Money (ATM) Calls of 4800 at 100 Rs each - Premium received 10000/-
  • You buy one Out of the Money (OTM) Call of 5000 at 35 Rs - Premium paid 1750/-
(I am not considering trading charges here. Please read earlier posts in case you are not following Premium calculations or Options Terminologies here.)

Below graph shows how will we fare with respect to NIFTY movement.


As you can see above, the maximum you loose is difference between the Premiums paid and received. So;

Maximum Loss = Net Premium Paid (60 Rs in this case) and it occurs when;
NIFTY is either lower (or equal) to Lower Strike or higher (or equal) to Higher Strike.

Maximum Profit = (Diff between Strike Price of Short Call and Lower Strike) - Net Premium
It occurs when; NIFTY = Strike Price of Short Call

So Maximum Profit = (4800-4600=200)-(60) = 140 Rs at 4800 NIFTY

Lower Break-even = Lower Strike Price + Net Premium = 4600+60 = 4660
Upper Break-even = Higher Strike Price - Net Premium = 5000-60 = 4940
This is the zone between which you make money.

So you are risking 60 Rs (60x50 = 3000 Rs) for a potential gain of 140 Rs (140x50 = 7000 Rs). However, note that this strategy is useful in sideways market. In a strong trending or volatile market, you will loose money more often than gaining.

The middle Strike is called as Body and two Strikes on either side are called as Wings. Now you can guess why the name Butterfly for this one. For once it makes sense. Another interesting derivation of this Strategy is when the Center Strike Price is not single one but two... means rather than shorting two Calls of one single Strike, you short one Call each of two close Strike Price in the Center. This is called as Iron Condor and you can read more about it here. Rather than a pointed cliff in above graph, it has a graph which resembles a flat top between two Center Strikes. Do let me know in case you want more on it. Until next post.

Happy Trading.

Note: My apologies for some mismatch in example and figures on the chart (only legends). Will correct them in the evening as I do not have access to it right now. Meanwhile you can read 4700 as 4600, 4900 as 4800 and 5100 as 5000 in the legends area. Chart otherwise is okay.

December 08, 2011

Update

I am feeling a lot better. In my last post I forgot to mention that sometimes last week I had managed to buy NIFTY 4700 PUT under 40 (all inclusive). It was a very small contrarian (opposite to majority) move which as I had mentioned I entered for the heck of it. I had this feeling that I will not lose money on it. It is not just gut feeling but the knowledge that there is more pain in the market. Today I exited it at a small profit deciding not to push my luck too far. Needless to say, I squared off without looking at the charts and finding about what is happening in Europe and America. Looking at the US Markets, I am getting the feeling that I hurried into it.

Well, no fun in crying over split milk... Market will be there tomorrow and so will be new trades and new money to be made. Looking at the chart below, it looks like that there will be a short term break at the NIFTY party and we may see some down moves now.


I, personally, am still a fan of the secret society who believes that NIFTY will touch 4700 at least once more. Tricky part is the prediction about the time. With some conviction I would like to say that it will happen before next months series ends. That also reminds me of my recent theory that 2012 (World may not end in it as shown in the painful movie) could be the worst (or at least one of the worst) year for the equities. I will make a separate post on why I think so.

Haven't looked at all the indicators in detail and hence not posting a trade right now but will definitely do that over the weekend and post something. Needless to say that I have been wrong earlier with both; my trades based on charts and also based on my beliefs/theories and I am proud about that. It only shows that I am just a human being; my falling sick also shows that on some other platform but that is now what I am talking here.

Until next post.

December 06, 2011

Markets this Week

Hi guys, I am back again. For those of you, who don't know, I was not feeling well and was slipping in and out of consciousness for last three days. It all started with the weekend exertion and manifested itself in to a full blown thing which culminated in me being stuck with bed all the time. Much needed rest I guess.

Not that I could have written much even otherwise. Markets continue to be unpredictable (what else was I expecting?) and no clear sign of resuming downtrend still. Yesterday Market formed a Doji indicating some indecision but as I explained on Doji Post on Equity Blog it does not mean much apart from indicating even honors for Bulls and Bears.

Looking at the Asian, European markets today and present state of US Markets I guess we may have a slightly negative opening tomorrow (off course unless US Markets spring a surprise in the later half). Important levels for tomorrow;

Support 1: 5010
Support 2: 4980

Resistance 1: 5062
Resistance 2: 5085

Some Explanation of these levels can be seen here.

Posting a chart indicating these levels. Click on it if you want to see the larger picture (pun intended).


Happy Trading.

December 02, 2011

Market this Week

The markets did manufacture a good turn around thanks to support from West. The idea of all large Central Banks coming together to loosen their purse strings in tandem is... to be honest... scary. It may help stock markets all over but watch out for commodities as well. May not be a good thing for developing economies which are fighting high inflation.

Anyway, coming back to NIFTY. See the chart below.


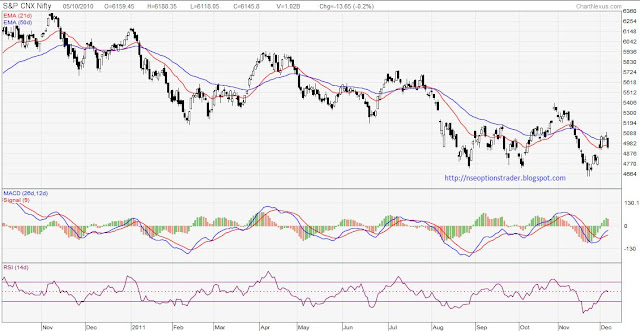
Market is clearly trying to get back to the upper end of the channel which lies somewhere over 5300... a long shot I would say. MACD and RSI both are in supportive mood though I have to admit. Today market has taken a support at the 21 day EMA which is at 4938 and the next immediate resistance is somewhere at 5018 which is 50 day EMA for the NIFTY.

I wanted to get in to the Trade with a 4700 PUT today but could not do so in time. Today Europe were down by up to 1% while US was half a percent down when I last checked before going to bed. If markets are in positive territory again, will get a micro PUT trade just for the heck of it.

Hope to have a more definitive trade for the coming week.
Happy Trading till then.

December 01, 2011

Market Today

Get ready for a bumper opening of at least 120-150 points. No definitive trade for this week from my side... Was cooling off.

Happy Trading.

Disclosure: Might buy a micro position on short side... May be a 4700 PUT.

November 28, 2011

Trade for the Week

Honestly, I do not have a clear trade this time around. As I said in the last week, NIFTY is very delicately balanced at around 20-30 points away from a Support. If it decisively breaks 4680 then we are looking at more than 200 points free fall.


Sooner or later I believe this is going to happen. In the chart above RSI is in extreme oversold condition and looks like turning back but MACD is not helping. Moving Averages are still diverging indicating strength in the downtrend. Even RSI upon a close look gives impression of flattening out rather than turning back. See below.


Click on the picture to see a larger image. My apologies for this technical mumbo-jumbo for the uninitiated of you. Keep following Equity Blog and soon enough you will be laughing about it.

We will have to kind of wait and watch NIFTY for the direction before entering in any trade. Even US markets are not helping much. Will use mobile for a short post in trading hours if opportunity arises.

Happy (no)Trading.

November 27, 2011

Trading Strategy - Spreads

Its been long time since we discussed any Trading Strategy. Last few weeks have been good and we made some money trading what we have already learned. There are very less times when you cannot use Straddle or Strangle to good use. And there are also times when you can use other strategies also in place of these popular ones.

Though I should have talked about Short Stradle and Short Strangle as a follow up of earlier Long Straddle and Long Strangle posts. However these strategies are Limited Profit and Unlimited Risk types and not my favorite. However if sometimes in the future if I have nothing else to talk about or one of you want to go down this road, I will make a post. Let me know.

Today we will talk about Spreads. Spreads is a Limited Profit and Limited Risk types strategy where you can skew the Risk-Reward Ratio in your favor. It consists of buying a Call Option (usually At the Money Strike Price) and selling a Call Option (Out of Money) of the same Underlying and with the same Expiry Date. Understanding of it will be much easier when we discuss it with an example.

Let us say that we are quite sure of the Market direction to be positive. We can simple buy a Call Option and let it play out. Now this is not a very (Unlimited) risky strategy considering that maximum loss possible is the amount of Premium that we pay. Question however is can we reduce the Risk without overly compromising our gain potential... in comes the Spreads.

Let us say, for the month of December; you are very sure for NIFTY to be positive and hence you want to buy Call Option. In Spread, you mostly buy At the Money Call so you buy NIFTY 4700 Call for 150 Rs (Total Premium 50x150 = 7500 Rs) and that is your Maximum Risk. Now you believe that the Market will be positive but at the same time you don't believe that the Upside will be substantial... so you do not expect the gain to be phenomenal. So you sell a Out of Money Call Option with a Strike Price of let's say 5000 at Rs 50 (Premium received 50x50 = 2500 Rs).

What you have done essentially here is you have reduced your risk to 5000 Rs (7500 Paid - 2500 Received). But in the process, you have also capped your maximum profit to 10000 Rs for a Lot. See the chart below.


Maximum Profit here is Difference between Strike Price - Difference between Premiums i.e. (5000-4700)-(150-50) = 200 per Nifty and hence 10000 per lot as above.

Maximum Loss is Difference Between the Premiums (150-50 = 100) i.e. 5000 per lot.

The Break Even is Lower Strike + Difference in Premiums as 4700 + (150-50) = 4800.

This strategy helps in trading in Markets where you know the direction and do not want to protect in the opposite direction (as in Straddle or Strangle). It helps you in reducing the risk by a definite margin and also caps your gains to a fixed amount. Explained here is Bull Call Spread and obviously there are Bull Put Spreads, Bear Call Spreads and Bear Put Spreads too used to similar effects. Finally there are Butterfly Spreads which is an interesting mix of these which we will cover in another post.

Will write another post if I can find some trade for coming week. Have a good one till then.

November 25, 2011

Markets Today

Yesterday Markets did a remarkable turn around to close in a positive territory. Support mentioned in previous post was not breached on closing basis. Intraday it went as low as 4639.

Yesterday's pull back cannot be read much into. I still believe Markets will have another (and successful) go at taking out the support around 4685.

Will write about fresh trade over the weekend. Happy Trading.

November 23, 2011

Expiry Tomorrow

What a week (or 10 days) it has been. No, for a change I am not talking about how busy I was. I am talking about the Markets... It just kept falling (it still is) with no end in sight. We are at 4700 today from a level of 5200 in the last week. A drop of 500 points in NIFTY.

Our last week trade of Strangle (5100 PUT/5300 CALL) turned out to be more profitable that I even imagined. Honestly I was also taken aback by the intensity of the move. I expected this drop to be more subtle and thought that it would play out over a longer period... it was not to be.

Anyways, fresh chart of the NIFTY below;


NIFTY right now is delicately balanced at a multi-year, multi-instance support by a margin of 20 odd points. If this long held support is broken then the next support is more than 200 points away and we will be in free fall. I would give more than 50% chance of this happening.

Tomorrow is the Expiry of November series and like it or not your trades will be ending tomorrow. I know, it is difficult to let go of such immensely gaining positions but don't worry we will have more such instances in the future... Amen.

Because of expiry tomorrow and my lack of practice in writing for last few days, will not write much today. Will write about a new Trading Strategy (Spread) and Trades for next week over the weekend.

Happy Trading till then.

Apologies

I am officially frustrated now. I have been trying to get back to my writing ways so hard... without success.

Today, I will resign from office if I have to... but will write a post somehow.

NIFTY 5100 Nov PUT is at an incredible 356... ten times our entry.

Happy Trading.

November 22, 2011

Market today

European and American markets are down substantially yesterday. However I do not expect Indian markets to follow them blindly.

SGX NIFTY is also in the positive region and so is some Asian markets. Go fresh short today at your own peril.

Happy Trading.

November 21, 2011

Coming Week

My apologies for absence in last week. Will try to make up for that soon.

For this week Market still seems to be in down trend. First support is around 4750 followed by 4690-4700 level. This week however can see some counter trend rallies as well.

I will be back with a full post very soon.

Happy Trading.

November 17, 2011

Trade for the Week - Analysis

NIFTY 5100 PUT right now is at 120+ which is almost 2-3 times our entry. You may want to book some profit. You can leave 5300 CALL as it is because it is anyway trading at 4. Keep it and you may get a better price (not by much) to exit.

Happy Trading.

Update: Wow, it seems market was just waiting for a sign from me to start their descent. Market just took off (downwards) after I posted. Hope you guys are making merry. Will post some new trading strategy soon.

November 15, 2011

Trade for the Week - Analysis

I could not post yesterday from mobile and also could not post in the evening. Was just too busy in office through the day only to be too tired at home.

Our reading of down trend in the market is working too well for us... I say too well because last two weeks as well as this week so far has been negative. We are due for a counter trend day at least. But mind you, this is pretty strong trend and normal expectations of a counter trend move may take some time to materialize.

Let's see status of our trade so far.


When I first posted the cost of one lot of 5300 CALL and 5100 PUT was around 95 and today it is 100... so not much to mention. However, lack of time on Monday morning caused to me to hurry up the post (I am also learning) and I did not elaborate on my way of trading a strangle (Caution: it may not be correct way).

Many a times lot of experts mention that hedging trades are difficult to be executed at the same time and so there is risk. You may not execute both buy/sell, CALL/PUT trades at the same time at the price you want which creates this risk. In my case, I intentionally do not want them to be executed at the same time... in fact I do not even place the orders together.

Usually when I want to trade strangle with the bias of a particular direction and market is moving in the same direction, it makes my preferred Option Premium higher and I don't like that so I tend to wait (even though I may not get the chance again as market may just run away in the same direction). I can just let it go consoling myself by saying that this is not the end of the world. Agreed that the Premium of the other Option (which is to be used for hedging) goes down but I do not buy it before making the main trade.

On Monday, however, market was moving in the positive direction in the morning making Premium of 5100 PUT Option go down to 33-35 levels. An ideal level for me to enter. In the afternoon, market resumed downtrend so our main Trade was increasing in value while hedging trade was going down giving us the opportunity to hedge the position at a much lower cost.

You may think that this is good to say in hindsight and difficult to execute actually... I agree. Not the hindsight part but the difficulty in execution part. You have to be looking at the market through the day to understand the undercurrent and then time your trade.

I will have to be more active in posting through my mobile I suppose.

As for the trade, both Europe markets and US markets (presently) are down marginally. The chart (not posted) still shows weakness so you may want to hold on to it. (Disclaimer: I missed the bus... was too busy.)

Will post about further trading strategies in between. Who knows, may be next post will be on some trading strategy. Happy Trading.

November 14, 2011

Trade for the Week

Hope you had a great weekend. My plan to write a post yesterday night went for a toss after some guests. So woke up early to study some chart and find out if some possibility exists for posting before leaving for office... oh these Monday mornings.

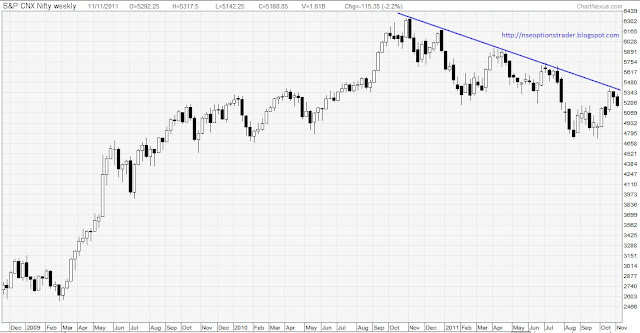
Well, the NIFTY chart is pretty interesting. On a weekly basis we are still going down with the resistance being at 5360... the same level as per our earlier charts (The upper trend line). Support levels are also not changed too much. On a daily chart however, there is a gap created on Friday which I guess would be because of trading holiday on Thursday. Our markets had to catch up  after joining the party so can't read too much in to that. Will write about significance of Gaps on Equity Blog.

Right now the chart looks like something like this.


Friday closing prices of NIFTY 5100 PUT is at 52 Rs and 5300 CALL is at 43.20 Rs and this is what I will get in to after looking at how the market behaves in the opening hour. Don't forget to read How to Identify the Trend and also this before trading.

My earlier experiment of posting from mobile worked well so will resort to that I get time and if there is some change in above.

Happy Trading and have a great week ahead.

November 11, 2011

Europe Crisis

What would happen if Greece was to leave Euro Zone?

This is the question only and only two categories of people are asking... Greeks and non-Greeks.
Well, there are no clear answers but there are many hypothesis available. Before that let's look at the two ways in which it will happen.

First, Greece is forced out of Euro Zone when other European Nations refuse to help it. This will create lots of problems for other smaller and in distress European Nations which may also want out before things go as bad as Greece. This will probably result in collapse of Euro Zone (banking system), end of Euro and probably a real unambiguous recession for the World.

In second scenario, Greece may choose to default and leave the Euro Zone voluntarily. This may be a better option for Euro Zone and it may just save it. In such case (if it happens when there is still time) EFSF will have more leeway to help Italy whose failure can have disastrous consequences across the world. It might just save Euro as a currency and it may actually turn out as stronger one after loosing it's weakest link of Greece.

What will happen to Greece?

There are again two possibilities.

First the bad news... total mayhem. Greece's new (or old) currency will devalue very rapidly. There will be bank runs by depositors to withdraw or transfer their savings in Euro. Because of fast drop in the value of the currency there will be high inflation (could be very high actually). Greece will open up their printing presses to print the money and pay back it's debt. This will also cause shrinkage in the GDP in actual terms. Greece citizens will face the double whammy of negative growth as well as high inflation.

Rest of the World also may not take this lightly and may ban or restrict trade with / investment into Greece. As it is Greece does not have many exporting industries and like many other Euro Nations, its appeal to Tourists is nothing extraordinary within Europe. It's banks will certainly fail and so many other who are exposed to Greek debt. While many will fail, many will be recapitalized by their own Governments, Unlike 2008 World financial freeze, there are ample warnings of these so initial shock will subside quickly and contingency plans (which have been definitely prepared by now) will be put in action.  After some time, World will move on. After how much time... depends on a Zillion factors.

Second scenario... and you have to rewind about a decade. Argentina was faced with a similar situation because it's Peso was pegged to Dollar as 1:1 and it was having huge debt (actually unmanageable) to repay. What they did? They decided to default but they planned it well. When they decided to default, they removed the pegging of Peso and at the same time froze all the bank accounts to prevent bank run (that was about Christmas time... you can imagine). Obviously people took to streets, burnt cars and looted shops and all that. Peso lost it's value and it soon became almost 4 Peso for 1 Dollar. Inflation increased to extremely high levels due to dependency of Argentina on Imports.

However, a week currency also made Argentinian Exports cheaper. Their exports to rest of the World soared and their new Government implemented policies to reduce their dependence on Imports. Over the years, after improvement in situation and creating trade surplus, Argentina started to buy back Dollars bringing Peso rate down. They also reopened negotiations with their debtors and finally paid 25-35% of original debt to clear the dues. There was lot of hue and cry from lenders, many went to arbitration and cases are still on... and Argentina still can't borrow at some places... who cares?

Similar story happening in the Greece is the ideal case for them. A systemic cleansing and disciplined approach with devalued Drachma (Greece's old currency) may make Greek assets very attractive to Investors around the World. Risk will be there but the possibility of good return will make 'not-so-risk-averse' entities reach Greece. Slowly but surely new political set up will find ways to build up GDP and growth will return. Meanwhile lenders will need to be treated taking a clue from Argentina. Obviously some European Banks will need some help from their Governments to stay in business and some will cease to exist. Life will move on after some time... 'Time'... which will be decided by a Zillion factors.

This is totally offbeat post which have been doing rounds in my mind for many days... I feel the possibility of Greece defaulting eventually is very high and that may trigger some scenario. What I wrote here could just be one of them.

Our trade analysis and post for next week will have to wait till Sunday. Would love your comments till then.
Have a great weekend.

Post from Mobile

NIFTY 5200 PUT is currently trading at 98 and you may want to square off the Trade for the Week. Will post again if a new Trade for the weekend is possible. No guarantees.
Happy Trading.

November 10, 2011

Happy Gurunanak Jayanti

Thank you guys. I love you all.

Thanks for adding insult and then rubbing salt into injury. Yeah, I know I totally missed today's trading holiday but why none of you were prompt enough to remind me of it before 09:15? Tell... tell...

Anyways... this situation has inadvertently given us something to discuss. What to do when we have a trading holiday between the week or what to do on Friday? To be honest, I don't prefer carrying any one sided trades over the weekend (particularly these days) unless I am in driving seat. This compulsion comes in two forms; once when I am very sure about the trade and also definitely have adequate hedge against any End of the World event. Second when my trades s**k so bad already that things can only get better from that point onward...

As for trading holidays... we can take them on case to case basis. In these uncertain times I would have closed my position yesterday only; after being content with 50% profit. But that was because I did not fully hedge my position. I would never do so in case of an off day or weekend and will always remain prepared for any adverse move. Luckily for me, this may not be a costly miss.

There are mixed signals from Europe and US Markets are marginally up. If things don't become hunky dory in US suddenly overnight then we are still in the game.

Ideally I would love to get into a Straddle or Strangle (with Negative Bias) tomorrow for carrying it over the weekend as things are very interesting in West. What Strike Price to choose depends on how the markets fare tomorrow. Whatever happens, we can expect a decent move on either side on Monday as weekend is too long a time not to happen anything.

Happy Trading.

November 09, 2011

Trade for the Week - Analysis

A recap of today's market movement in our trades.


It was really good day for us and both the contracts are almost 50% up from the point of our entry. At this time it will be difficult to resist the temptation and take home some profits.

My entry point was 55 and a gain of 50% minimum is what I look forward to. 50% of 55 is 27.5 and hence my first target was (55+27.5) 82.5 which was achieved today. I sold part of the position to book the profit partially. Accordingly I reduced hedge position also. This kitty already is in the bank and gives me good leverage cushion for the remaining position. I can be more aggressive with the stop-loss and wait longer for next target... correct?

No, I do not work it that way. I will, on the contrary, move my stop-loss closer to the present price so that my already booked gains are not wiped clear by remaining position. I will rather book a modest profit in the remaining position... close this trade completely and move on to next trade. Old adage is let your winning horse run and cut the losses in other cases cannot be more true.

One more thing is I would have been happy to close the trade completely today itself and have fun for the rest of the week . This would have been completely acceptable if our target was 50% as usually the case with me. However this target cannot be a rigid thing and you have to adjust your expectations dynamically. Looking at the events in Europe where Italy is trying hard to join the party with Greece... things can get extremely messy. Present stress in the market due to Greece would feel like a bruise against a full body fracture that Italy can induce across the world markets. Hence stayed on the short side (with hedge off course... you can never be sure). However the trend is clearly downward. Have a look.


As of now US Markets are down (more than 2%)  in line with Europe and that bodes well for our trade. The chances of them coming back to positive territory are not very bright but respect your stops and targets. I will book full profits if 5200 PUT reaches 100 tomorrow.

Happy Trading.

November 08, 2011

Trade for the Week - Analysis

A recap of the day for underlying of our interest;


NIFTY was moving to our advantage until European Markets opened and then we got back into positive territory. I got into NIFTY 5200 PUT at around 55 price in the morning. Did not square off during lunch time and could not create a full hedge also in the late afternoon. I created partial hedge not because I did not get time but because I was not convinced about European Market move (You are advised not to have such single sided position till you get enough confidence and your risk capital is high).

I got two interesting e-mails about today and we will discuss that here.

First, regarding stop-loss of 5360. Query was if NIFTY reaches this level; then PUT Option of 5200 would be almost worthless and 5300 would be less than half of original Premium... So isn't the stop-loss too far away?

Here my logic is... Option trading is not like intra-day where you have to square it off on the same day. In such case you do not have time for Index to recover (or correct) in the direction you want. However in case of Options, you get some time (in days) for such move and hence if you keep stop-loss very close then there are chances that one day or even couple of hours of adverse move will trigger it and you end up squaring off at the wrong time.

Hence going by the chart in previous post, 5360 is the level indicated by trend line and also somewhat closer to 200d EMA and unless NIFTY decisively crosses them, these levels are expected to hold.

Second e-mail which I received this evening is regarding squaring off of the trade today itself. One of you bought NIFTY 5200 Put at 56 and squared off at 68 making a neat 20% profit in one day. Now this is something very good... isn't it?

No, it is not. If you ask me I will say that Option trading is a risky business and hence accordingly your reward should be higher. 20% profit in one above lot is a sum of 600 Rs and you need to look at the profit in absolute terms as well. Since your stop-loss was almost 80 NIFTY points away (where you would have risked loosing something like 1500-2000 Rs of your original 2800 Rs Premium) your target reward should have been attractive enough for this kind of risk.

Now I am not totally against booking a small profit initially and gaining confidence. However, as we move along it is important that we keep above logic in mind and decide our targets accordingly.

US Markets are showing marginal negative move as of this moment and I will say that Fundamentals of our Technical trade is still intact. More tomorrow.

Happy Trading.

November 07, 2011

Trade for the Week

As I am writing this, US markets (DJIA and S&P500) are around 0.7 to 0.8 percent down. Any drastic changes in this scenario by closing time... changes the trades below. As for tomorrow and the week I expect the market to have negative bias with many key events like Europe Meetings, Italy Vote and US Consumer Data coming in at crucial times.


Markets are already touching the upper trend line as can be seen above and the chances of a breakout from this trend line tomorrow are very rare. So in a negative downtrend what you do is simple... you buy a Put Option. As per Friday's closing prices a NIFTY Put Option with expiry of 24 Nov with Strike of 5300 (In the Money) is approximately 95 Rs and Strike 5200 (Out of Money) is roughly 59 Rs.

You can decide to buy any of this Strike. Stop loss should be at the trend line which is roughly 5360 and you can book your profits at first target (Support) of 5200 (it is possible in intra-day also). If your risk appetite is high you can continue to hold the position and take a call depending on how Europe Markets move in the afternoon.

If you decide to hold the position overnight, do not forget to create a hedge by buying a Call Option at the same Strike (Straddle) or a Strike which is Out of Money and Premium is less (Strangle). This is advisable even if you think that the risk is minimum and you can live without a hedge... it gives you peace of mind and that is something Master Card cannot buy. It is priceless.

Trade for the Week - Starting Point

Well, we have been waiting for this for very long. It seems to me that we have actually covered quite a bit of ground (looking back, it feels amazing) such that we are ready for spinning a few trades. However, we will set a few ground rules before we make posts about trades. First and foremost is clearing myself of any responsibility about these trades... I repeat do not take these trade posts (or any posts here) as an Investment Advice and I can not be held responsible for any loss you incur by following this. As for profit... I may have second thoughts. Seriously speaking... please read this before proceeding further.

Second thing, I will be making this post a night before or at most in the morning before leaving for office once I check status of US markets. I will also try to post scenarios like if-then for you to make a better decision about trades in the live market. Also I may or may not execute the trade depending on whether I get time to do so in office or not. Then I will post the loss-profit analysis for one lot each of the trade I post. Will make a format for that which can be followed then.

As far as possible, I will try to trade the immediate series as that is most liquid and made available by all brokers without fail. In exceptional cases only we will include next month series in the trades.

In between these posts, I will keep posting about further refined strategies for Options Trading. We will also see some advanced strategies and try trading them if favorable market situation is available.

Finally, how much money we make will also depend on how actively we follow market and how well we stick to our stop losses and how well we are able to time our trades. Let's give it a shot.

Meanwhile hope you have seen the twin posts on twin candlestick patterns on Equity Blog. Will post more on that regularly now.

November 06, 2011

Support and Resistance

I could not follow up the earlier Support and Resistance Post where we discussed how can we ascertain these levels without charts. At the end of that post, I mentioned that we will see how these levels compare to the Chart Levels. A week of two has gone by so let us repeat the calculations for the last week.

Week (Oct 31 - Nov 04)

Highest 5360.25 Oct 31
Lowest 5201.85 Nov 03
Close 5284.20

Avg 5282.1

Support        5203.95
Resistance   5362.35

Now let us see how does it compare with the charts. Following is the NIFTY chart with Support and Resistance Levels marked on it with the help of trend lines - Channel as well as Horizontal support line.

As you will see, Resistance of 5360 is as close as we can get to the calculated value but Supports of 4700 or worse 4530 are far off. Let us see if some other method helps.

In the chart above, 21 Day and 200 Day Exponential Moving Averages have been plotted. I have made a note to make a post on Moving Averages... will do that on Equity Blog. These two are probably the most popular EMAs used across the board. 21d EMA here is close to 5162 and 200d EMA is around 5336... not far from our calculated values.

Well, it is possible to arrange the charts in such a way that we will get the Support and Resistance values close to our calculated levels by playing around chart type (daily, weekly, etc) or by taking various EMAs or SMAs (Simple Moving Averages) like 20d, 50d, 100d, etc or by drawing various trend lines as per our convenience. But that's not the idea... Calculated levels can and will sometime differ from Chart Levels and sometimes they will be matching ditto. However as I mentioned there are various ways to determine these levels on a chart and different traders will have these values different from each other.

Idea is to find a combination that works for you and then trade by it. Next post tomorrow.

November 01, 2011

Update on Equity Blog

Have started writing about Candlestick Patterns on Equity Blog and have discussed Doji candlestick today. These posts will be useful for us here on Options Blog too. Even if you do not want to have anything to do with Equities here, it will be a good idea to visit the post here.

Will write next post here soon.

October 31, 2011

Margin for Options

Hello everyone, welcome back. Hope you all had a great time during Diwali. I was back in Pune yesterday night and was waiting eagerly to get back to writing ways. Surprisingly, even during the vacation... thought of writing couple of times. Hope that's a good sign.

Anyways, have to keep Support and Resistance post on a hold for the time being. Reason is, along with Support and Resistance level, we will also discuss trading strategies depending on them. These strategies will necessarily involve selling options at times for which it is imperative that we understand how margins work for Options. Hope all of you have gone through the Margin Post on Futures Blog as we will use that as baseline here.

As we have seen in Futures Blog, margin consists of two parts - SPAN and MTM. However, in case of Options, it is different due to the inherent difference between Futures and Options. While both parties are bonded by Futures contract and have obligation to settle it; in Options only seller has the obligation. Buyer of Option has the right but not the obligation to fulfill his side of the bargain. So obviously no cracker or Diwali sweet for you to guess that a buyer of the Option does not have to pay any margin. He pays the premium upfront and that is as much deep as he can sink in it.

However, a seller (Option writer) receives the Premium for writing the Option. This premium is added to margin requirement and just like in case of Futures; it is calculated daily. If you recall the Option Pricing posts (this and this), Premium already covers the Intrinsic Value of underlying or in other words Mark to Market component. Not to forget, it also covers the volatility component within the Premium. This means premium of the Option theoretically covers SPAN as well as MTM part of contract. So if premium goes north/south, your margin requirement changes accordingly which you have to oblige. There is no MTM or SPAN as it is not needed and you have to make sure that the you keep the margin equal to or more than the current premium of the contract in the market. Another no brainer is that Margin does not go to ridiculously low levels even if Premium approaches zero as there is a minimum margin (Short Option Minimum Charge) that you have to keep with the exchange at all the times.

Will write more on Margin on Futures Blog in a while. Don't forget to read and comment. Also do let me know if you have any questions.
Welcome back once again... let's ride.

October 26, 2011

Happy Diwali

Rather than writing more about Support and Resistance as I said in the last post, today’s post is just to wish all of you and your loved ones a Very Happy, Joyous, Prosperous and Safe Diwali.

Also if you want to read something today please see my new post about Margin on Futures Blog and on Japanese Candlesticks on Equity Blog. Needless to say, will wait for your comments.

Next post will be on finding Support and Resistance again. It will be followed by long overdue post on Margin Calculations. For both these posts, it will be important for you to go through the posts on these two blogs. We will be using them as basis of our discussion.

Once again, wish you a Very Happy Diwali. Have a rocking time.

October 24, 2011

Support and Resistance Levels... without Charts


In the death overs of last post I said something about Supports and Resistance without charts... let’s see how we can do that.

Just a small detour before we get to that. As you guys know that I cannot and do not want to trade from office as far as possible. I can call up the broker if some really really great opportunity knocks but it has not happened so far. I only look at the market trend and do the predetermined trades based on homework a night before. I miss the college days for that freedom...

The point here is because of my inability to track the market hourly or daily… I work with weekly levels. I decide the Supports and Resistance based on weekly charts and accordingly open the trades. I try to close all my positions on Friday and start new positions on Monday. Another thing is I am not a compulsive trader... it is very dangerous thing to be and I will talk about it on Equity Blog. So I trade when I get the risk-profit ratio in my favor or suiting to my appetite or otherwise I simply let it pass.

Coming back to main objective of our post, I will explain how to find out Support and Resistance levels for the week based on data of previous week (disclaimer: I do not use this system anymore and prefer charting and hence have not used it for a long time).

First step is to find out Average Level of NIFTY for the week gone by and it can be done as below;

Avg Level = Avg (Highest Level, Lowest Level, Weekly Close)

From this 4 data points(3 levels of NIFTY and Avg Level as calculated) we can get Support and Resistance as below;

Support = 2 x Avg Level - Highest Level
Resistance = 2 x Avg Level - Lowest Level

Let’s see the illustration for the last week;
Highest Level = 5160.25 (Monday)
Lowest Level = 5011.05 (Tuesday)
Weekly Close = 5049.95

Avg Level = 5073.75

Support = 4987.25
Resistance = 5136.45

Have to rush someplace so follow up, comparison with charting levels, trade as per these levels and more in the next post.