September 02, 2012

Market Outlook

I am here again and wanted to write a tutorial before this post. Have started writing it and it should be online for you tomorrow or day after. In the meantime, in this post, I thought of taking stock of our Market and see if any trade exist for coming week. Hope you will like it.

So without wasting any time, let us see the NIFTY chart.


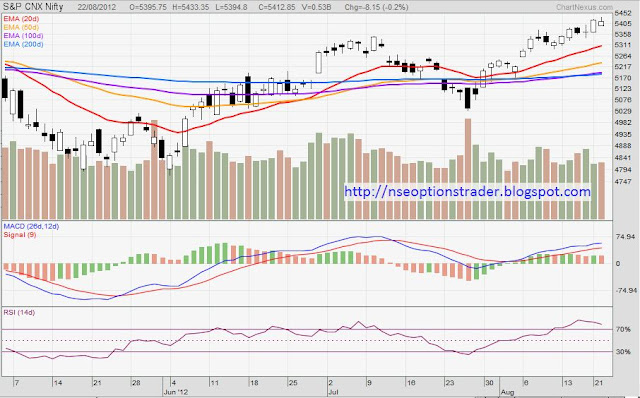
As you can see in the weekly chart above, NIFTY has erased the gains of previous three weeks in the past week alone. It is very frustrating for investors who see values of their picks going up inch by inch and then all of a sudden everything comes crashing down. But it was always on the cards. Right now also as you can see for NIFTY to maintain its bullish momentum the critical level is 5100 as depicted by horizontal line of low of July second week. So we may not be completely out of woods as yet.

This same support is around 5050 on daily level. See below;


RSI is not indicating any oversold condition at all and even MACD (which you will see soon in a tutorial post) is not indicating any reversal. We may not have any respite from downtrend immediately.

I was thinking of making a Straddle or Strangle or Spread trade suggestion but am seriously short of time to work it out. Have to seriously make an automatic excel based worksheet to do the calculations based on the NSE quotes exported or updated directly into it. Will take some doing but it will be a wonderful tool to help us decide things much faster. I had something similar before but it was too crude. Have to make a professional version of it. Will let you know as and when it is done and will also share it with you guys.

Right now, for trade, my thinking is like this. I expect some kind of (at least temporary) up-move on daily or intra-day basis and if I want to trade for a week, I will short the markets tomorrow (if) after they go up. Am expecting markets to maintain downtrend on weekly basis and hence expecting to square off this trade during the week sometimes.

However if I want to keep the trade till end of the series then I would like to think of markets getting back to positive territory after falling for a week or two. This is with the assumption that markets will not violate earlier low as seen above. So I would like to go long sometimes during this week or next for a trade which I want to keep till end or close to end of current series. I hope to get in around 5100 or 5050 level but I will keep position short with some serious stop-loss.

Once again, I will remind you that this blog is not intended as an investment advice for you. It is just my loud thinking about what I expect in the markets. Follow it at your own peril.

Then there is a dearth of comments from you guys. Please let me know what you think of the posts and what would you like to see my writing. It helps surely. Will be back soon with MACD. Happy Trading.

August 28, 2012

Off the Track...

I thought of making a trading post but then I realised that this is the expiry week so trading post can wait for some time. We can do that for next (September) series in a couple days and we will still have ample time for trading.

As I said in last post, I have been feeling like making a philosophical post for some time now. Have so many things which create lot of thoughts in my mind like situation which is (still) unfolding in Europe, Anna's failed campaign, Blast in Pune, Coal-Gate, Maruti Violence, Apple vs Samsung, North East issues and ban on social media and so many other issues. It is commendable that an average Indian still goes about his life in usual way and does not loose sanity with so many mediocre things around us.

But before I go about my ranting, NIFTY weekly chart gave as clear a 'Shooting Star' as possible.


This is as clear as it gets. Though not as strong as Gravestone Doji but Shooting Star is also a trustworthy pattern in its own right. Moreover there are too many things pointing southward journey for equities in the short to medium term. If I am forced to, I am trading short. (Ignore the last candle which is for current week and it may change by Friday).

Also I wanted to write about few specific stocks if you remember. And when you talk about NIFTY you cannot escape talking about RELIANCE.


Reliance price has broken from its very long channel and is decisively above it. It has also broken its long term moving averages from below and right now comfortably above all of them. More interestingly it is all set for a Golden Cross in coming few days which may also coincide with price taking support either at 200 MA or upper line of the channel. It can see a bounce back from there. I will wait for confirmation from few more indicators and trade long if I have to without hurrying into it.

If NIFTY has to get to new highs; change in trend for Reliance is (almost) must. It has lot of weight in NIFTY and will have to turn around for NIFTY to have a reasonable chance to go up.

It took me some time between writing that first para and then posting these charts (a day in between actually, started writing this post yesterday and had to leave in between) and writing about them. Lost the steam to rant about issues mentioned. May be some other time. Hope you will like what has become of this post. Do let me know. Happy Trading.

August 22, 2012

Hat-trick Post

Wow, this time around I could actually do it and I am back with my third post in three days. This goes to show that nothing is i-m-possible.

After thinking about what to write, I decided to let it flow freely without any particular agenda. So even I do not know what will come out of this but before that let us have a look at the NIFTY Chart below;


Of particular interest is the last candle on the right (candle of today). I do not know if you also see it but it appears a close 'Shooting Star' candle to me and if you have forgotten what it means, you can read it here. If true, it simply indicates that the uptrend is near an end for the time being and we may see some correction. Also, if you will notice you will also see an 'Inverted Hammer' around 25th July followed by bearish 'Marubozu' and subsequent change in trend in next couple days. Candlesticks continue to amaze me.

Usually whenever I come across something like this, I like to test my hypothesis on a larger data set. NIFTY and SENSEX with all the data in them have the limitation that they represent 50 and 30 from thousands of stocks in them. This sometimes limits the universality of our analysis. Just to weed out this factor I had a look at the NIFTY 500 chart; and behold the Shooting Star in all its glory.


Shooting Star is much more clear in case of 500 NIFTY stocks. Now this also coincides with an (over)due correction in S&P 500 of US which has defied all odds to go past 1400. It surely needs a breather. Have a look and notice that the last up move has lasted without correction a lot longer than earlier 4 cycles since June.


Almost every chart I see is calling for some correction (or at least a halt in the uptrend) but will it happen? I cannot say but all the needed signs are in place. (Cannot help but mention that; Look at the S&P500 chart and series of higher highs and higher lows since June.. classical) One more thing to note is how much the price has stretched above 50 and 200 Moving Averages. Usually prices tend to come back to MAs and larger the stretch, more violent is the retraction.

In all probability we are in for a small correction. It may be a small counter trend move as usual and may not mean much in the larger scheme of things but nevertheless it may give us some opportunity to initiate a trade.

Then, its been long since I made any philosophical post and I am feeling like giving it a shot. Stay tuned, it may be just around the corner. Right now, this post has stretched a lot so will stop now. Will be back, who knows, by tomorrow. Happy trading till then.