September 30, 2012

MACD

MACD

Its been long time since I posted any tutorial. MACD (Moving Average Convergence-Divergence) post has been in work for past 2-3 weeks and other post took precedence due to very dynamic moves in the markets but I will feel guilty to delay it any further.

We have already seen Moving Averages which are trend following Indicators. We have seen RSI which is an Oscillator. Both have their own advantages and downside. MACD, to start with, you can say combines best of both Worlds. MACD takes two trend following Indicators (Moving Averages) and turns them into an Oscillator. MACD gives us valuable information about not only the trend but also the momentum (strength) in the direction of the change. Before deliberating further, let us see how MACD is defined and constructed.

MACD consists of three components usually defined as MACD (12, 26, 9) which is most popular combination. 12 and 26 here depicts that MACD is using Exponential Moving Average of 12 duration and 26 duration (Days, Weeks or Months) for calculating MACD Line. Third letter, 9 indicates Exponential Moving Average of MACD Line for 9 duration which is used as Signal Line. MACD Line is calculated as 12 EMA Value - 26 EMA Value and Signal Line is calculated as 9 EMA of MACD Line. Histogram that you see with MACD is the difference between MACD Line and Signal Line. The centerline around which MACD Line oscillates is also called as zero line. You can use other durations for constructing MACD depending on your time horizon and sensitivity requirements. Please see the MACD in the chart below to familiarize yourself with above terms.


Reading MACD

Let us now see how exactly we get information from MACD. As per above formula if 12 EMA (which is faster, more responsive) is higher than 26 EMA, the MACD Line is in positive territory. Positive value increases when 12 EMA is increasing at a faster speed with respect to 26 EMA which also indicates that the positive momentum is increasing. Similarly when negative value increases, it means that 12 EMA is lesser than 26 EMA and the difference is increasing indicating a stronger negative momentum. This is the most basic reading of MACD.

MACD Signals

Traders use MACD is varieties of ways to identify trading signals. Some of the popular MACD Signals are listed below;
  • Signal Line Crossovers
  • Centerline Crossovers
  • Divergence

I will make another post to explain each of the above strategy in details and with examples.

In a nutshell

MACD has the unique advantage of identifying trend as well as strength (momentum). Unlike RSI, MACD does not help in identifying overbought or oversold conditions and it does not have any upper or lower levels which limit its movement. Since MACD is a difference between two EMAs, its value depends on value of the underlying and it may totally differ for a stock worth 10 Rs or for NIFTY at 5700 level. Hence don't compare MACD of two different scripts or underlying with each other. Also, we can use different durations of EMA to change the sensitivity of MACD e.g. MACD (5, 31, 5) would be more sensitive than MACD (12, 26, 9). I prefer to go with the standard used format of (12, 26, 9). Never felt the need to try any other combo.

Now, after completing this post, I am feeling a lot better and lot lighter. Will quickly complete the follow-up post on MACD Signals with more graphs and little commentary to close this chapter. As usual, will lover to know what you think of the post so go on and let me know. Happy Trading.

September 24, 2012

Is this Rally for real?

(Caution: Time reference of this post is Friday 22nd September 2012)

Whoa... NIFTY made a 52 week high today. What a rally. Honestly speaking, how many of us were expecting it? We were around 4770 in June with all gloom and doom. We usually have these extremes moodswings before any turnaround. In Jan 2008 there was this height of optimism where one could easily hear all our everyday friends like Chaiwale Bhaisaab, Doodhwale Bhaisaab, Autowale Bhaisaab talking about Sensex and all rag to riches stories that they had to share. And just at the start of this month there was so much pessimism regarding Government, Policy Logjam, Coal-Gate, Parliament Adjournment and what not. Then this massive move today made my last post expecting some fight between bulls ans bears look like a silly joke... so much for news based Markets. So are we out of the woods really... is this rally real and is actually start of a massive Bull Market?

Obviously I do not know. Definitely not yet.

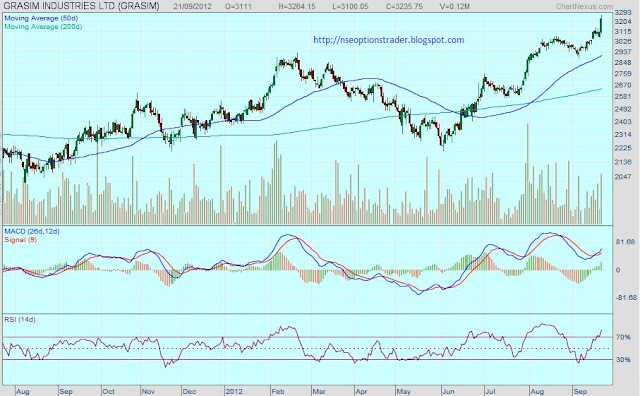
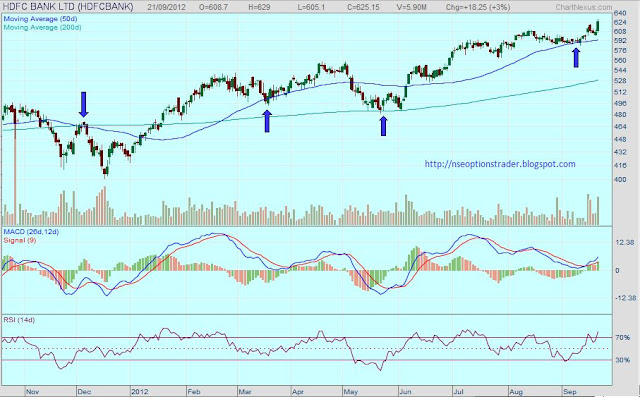
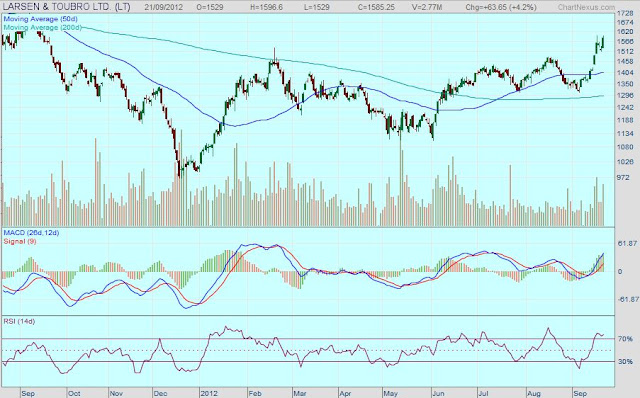
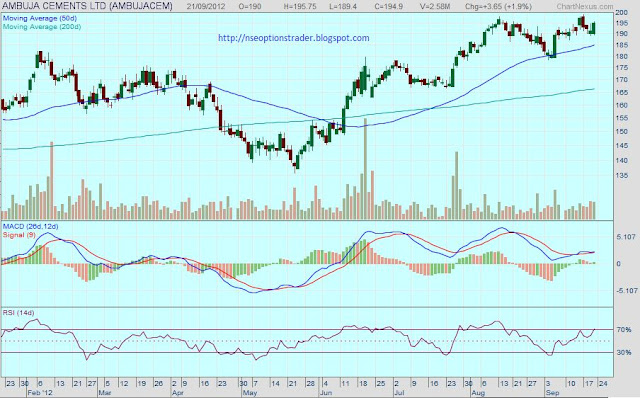
But let us see some facts. That's what we can do and try and decipher some signals from those facts. Today along with NIFTY, there are not one or two but 20 stocks which are close (within 7%) to their 52 weeks highs. Many of them are real close within 2% and some 5% while 4 of them have actually made these highs today itself. These 4 are; Grasim, ICICI Bank, Kotak Bank and HDFC Bank and real close are L&T, HDFC and Ambuja Cement. No wonder most of them are Banking stocks (that actually worries me as well) with all reforms, CRR cut and all that. It may take me few months to write everything about these stock from fundamental analysis point of view and by that time data might have changed already... ruining all my efforts. So I will do what I can do in lifetime of this post... post charts. I will post only one bank stock so that we also cover many sector's stocks in the process (note that stocks here may not be true indication of their respective sectors).

1. Grasim

Found really nothing remarkable about the chart. Just that it is following up NIFTY movement. RSI is in overbought zone but it can stay there at higher levels for longer time. Just look at RSI in August.

2. HDFC Bank

Nothing special again. This script has been taking good support and resistance levels from Moving Average lines. Multiple occasions can be seen above. Right now however, it is comfortably placed above MA lines.

3. Larsen and Toubro

Move from 1300 to 1600 in less than 4 weeks. Very impressive. This script is one of my long time favorite for intra-day as well as long term investments. Its been a laggard for some time in tracking NIFTY but surely trying to play catch up.

4. Ambuja Cement

4 out of 4 charts are showing a Golden Cross where 50 MA has crossed 200 MA from below.
4 out of 4 charts are showing no serious overbought condition.
4 out of 4 charts are showing good moves with above average volumes.
4 out of 4 charts are showing values stretched above their MAs

I am trying to see some sign of exhaustion in the rally and unable to see anything wanting serious caution on NIFTY or its components as of now. What this entails is enjoy the rally while it is in play but keep strict profit targets and stop losses. It is very easy to make notional money in the present market, difficult is to keep it.

Wanted to do this post on Friday itself but was unable for one or the other reasons.... very sorry. I will make another post on similar lines where I will examine major World markets in details to see if they help us in understanding the trend and timelines for this rally.

I should be able to do that tomorrow. Happy Trading till then.

September 19, 2012

Interesting times as usual...

Happy Ganesh Chaturthi to all my readers. May the Lord Ganesh bring happiness, health and prosperity to all of you and your families.

Well, coming back to Blog, I hate to boast but NIFTY just touched 5650 and turned back. It made a high of 5652.2 briefly on Monday and settled to 5600.05 yesterday. If you recall last post, I had hoped a return from the very same level based on plotted Fibonacci levels on the chart. Now I know the next question to your mind is how deep this correction will be? Well, the answer is not simple. Let us try to see both sides of the coin here.

First of all, I am not saying that this is correction at all. I just thought that markets will feel exhausted and run out of steam and will take a pause and it was true for markets around the World. I surely expect some more downward bias courtesy Mamata Didi. She did what she does best and put a spoke in the reform cycle. She would surely have her arguments and (misinformed) advisers to think that FDI is against farmers and 24 cylinders a year is the right amount for a poor household. Her withdrawing support to UPA when she had the option the stop FDI and increase no of cylinders in West Bengal on her own is real hypocrite behavior but it also throws up a real opportunity for UPA to get rid of her for good. She has been the main reason for delay and paralysis on reforms in UPA. Hopefully Government will survive and we will have more steps taken to revive the economy.

On the other side, I do not expect the downward move to be very steep or deep. PC has been very active in Finance Ministry since taking charge and has already made statements that more announcements are in the offing. He has virtually said that RBI will cut interest rates on October 30th (almost) as Government will be taking a lot more fiscal consolidation steps between now and then. Markets will be all ears and will be averse to go down too much anticipating some measures.

Let us see if any clue with Technicals on the chart;


On the chart front, there is hardly any movement since I last posted expect that RSI has turned down a little on daily basis (not shown here). The trendline shown above and also the 50% retracement from Fibonacci levels in last post, both indicate a support at aroud 5430. Now that is pretty deep cut from current level of 5600 but that is a very strong support I would say for the short to medium term (till next week). I will not rule out its possibility completely as a lot will depend on not economic but political news in next few days. I will not underestimate capacity of our polity to spring few surprises. Also we will have some F5 (refresh) movement about problems in Europe and QE3 euphoria will likely take a back seat for some time at least.

Just to summarize, expect a tug of war between Bulls and Bears for some time. Expect good moves on either side and sideways movements, some consolidation (all that) till we get some more clarity about World economy and situation close home. Undoubtedly, we live in interesting times.

All in all, a very uncertain time ahead for next week and half. May Lord Ganesha, Lord of Wisdom give much needed wisdom to the people who matter and they take all the right steps. May everyone is this country and in this World benefit from these steps and lives of all the people get better and better.

Happy Trading.