August 28, 2012

Off the Track...

I thought of making a trading post but then I realised that this is the expiry week so trading post can wait for some time. We can do that for next (September) series in a couple days and we will still have ample time for trading.

As I said in last post, I have been feeling like making a philosophical post for some time now. Have so many things which create lot of thoughts in my mind like situation which is (still) unfolding in Europe, Anna's failed campaign, Blast in Pune, Coal-Gate, Maruti Violence, Apple vs Samsung, North East issues and ban on social media and so many other issues. It is commendable that an average Indian still goes about his life in usual way and does not loose sanity with so many mediocre things around us.

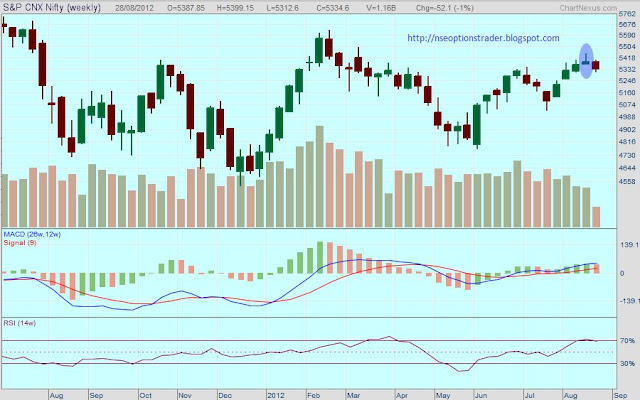
But before I go about my ranting, NIFTY weekly chart gave as clear a 'Shooting Star' as possible.


This is as clear as it gets. Though not as strong as Gravestone Doji but Shooting Star is also a trustworthy pattern in its own right. Moreover there are too many things pointing southward journey for equities in the short to medium term. If I am forced to, I am trading short. (Ignore the last candle which is for current week and it may change by Friday).

Also I wanted to write about few specific stocks if you remember. And when you talk about NIFTY you cannot escape talking about RELIANCE.


Reliance price has broken from its very long channel and is decisively above it. It has also broken its long term moving averages from below and right now comfortably above all of them. More interestingly it is all set for a Golden Cross in coming few days which may also coincide with price taking support either at 200 MA or upper line of the channel. It can see a bounce back from there. I will wait for confirmation from few more indicators and trade long if I have to without hurrying into it.

If NIFTY has to get to new highs; change in trend for Reliance is (almost) must. It has lot of weight in NIFTY and will have to turn around for NIFTY to have a reasonable chance to go up.

It took me some time between writing that first para and then posting these charts (a day in between actually, started writing this post yesterday and had to leave in between) and writing about them. Lost the steam to rant about issues mentioned. May be some other time. Hope you will like what has become of this post. Do let me know. Happy Trading.
August 22, 2012

Hat-trick Post

Wow, this time around I could actually do it and I am back with my third post in three days. This goes to show that nothing is i-m-possible.

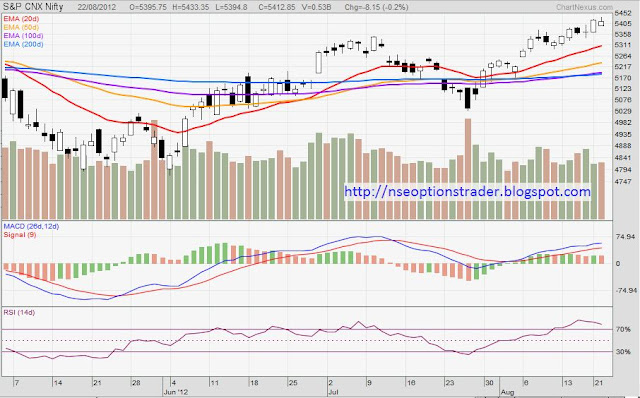
After thinking about what to write, I decided to let it flow freely without any particular agenda. So even I do not know what will come out of this but before that let us have a look at the NIFTY Chart below;


Of particular interest is the last candle on the right (candle of today). I do not know if you also see it but it appears a close 'Shooting Star' candle to me and if you have forgotten what it means, you can read it here. If true, it simply indicates that the uptrend is near an end for the time being and we may see some correction. Also, if you will notice you will also see an 'Inverted Hammer' around 25th July followed by bearish 'Marubozu' and subsequent change in trend in next couple days. Candlesticks continue to amaze me.

Usually whenever I come across something like this, I like to test my hypothesis on a larger data set. NIFTY and SENSEX with all the data in them have the limitation that they represent 50 and 30 from thousands of stocks in them. This sometimes limits the universality of our analysis. Just to weed out this factor I had a look at the NIFTY 500 chart; and behold the Shooting Star in all its glory.


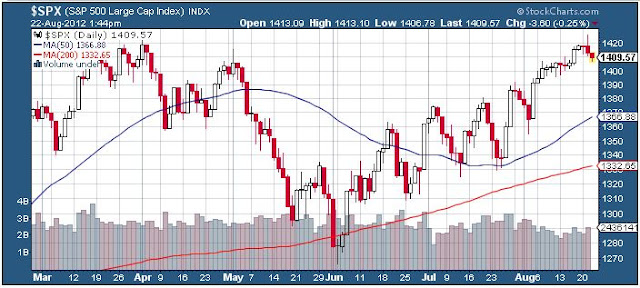
Shooting Star is much more clear in case of 500 NIFTY stocks. Now this also coincides with an (over)due correction in S&P 500 of US which has defied all odds to go past 1400. It surely needs a breather. Have a look and notice that the last up move has lasted without correction a lot longer than earlier 4 cycles since June.


Almost every chart I see is calling for some correction (or at least a halt in the uptrend) but will it happen? I cannot say but all the needed signs are in place. (Cannot help but mention that; Look at the S&P500 chart and series of higher highs and higher lows since June.. classical) One more thing to note is how much the price has stretched above 50 and 200 Moving Averages. Usually prices tend to come back to MAs and larger the stretch, more violent is the retraction.

In all probability we are in for a small correction. It may be a small counter trend move as usual and may not mean much in the larger scheme of things but nevertheless it may give us some opportunity to initiate a trade.

Then, its been long since I made any philosophical post and I am feeling like giving it a shot. Stay tuned, it may be just around the corner. Right now, this post has stretched a lot so will stop now. Will be back, who knows, by tomorrow. Happy trading till then.

August 21, 2012

RSI Demystified

Here I am... as promised. After the last post and the reference to RSI, it is but natural that I talk about RSI today. It was a close call as I also wanted to discuss few individual stocks which are getting interesting but then those have to wait for another time.

Some basics before we start; In technical analysis we have indicators and oscillators. Indicators are calculated based on the price, volume, momentum, volatility, etc. They give us additional information about the price and help us in technical analysis. Indicators which vary only in a range are called oscillators and Relative Strength Index (RSI) is one of them. It tells us about the strength or weakness in the trend of the security being analysed. It is calculated as;

RSI = 100 - 100 / (1 + RS)

Where RS = Average of x days' up closes / Average of x days' down closes

Usually RSI is calculated for a period of 14 days and it is the most popular duration. So for 14 days; RS = (Sum of Gains over last 14 days/14) / (Sum of Losses over last 14 days/14)

The formula above makes sure that RSI varies between 0 and 100. However, RSI does not practically go to 0 or 100 very often. We have seen RSI in many charts so I do not need to post one to explain more.

Most important use of RSI is to confirm the trend. If you think that the security is in an uptrend, be sure to confirm that RSI is above 50. Similarly RSI below 50 acts to help us confirm the downtrend for the security. However, main question is how do we use RSI for trading? There are various ways of doing so... some of them are;
  • Overbought / Oversold conditions
  • Divergences
  • Positive / Negative Reversals
  • Failure Swings
  • Trending IDs
What we generally use is the first two. Rest of them do not occur often and are not so easy to spot. Overbought condition was already (more or less) explained in last post. Only thing to add here is it is universally accepted that RSI above 70 is overbought condition and below 30 is oversold condition.

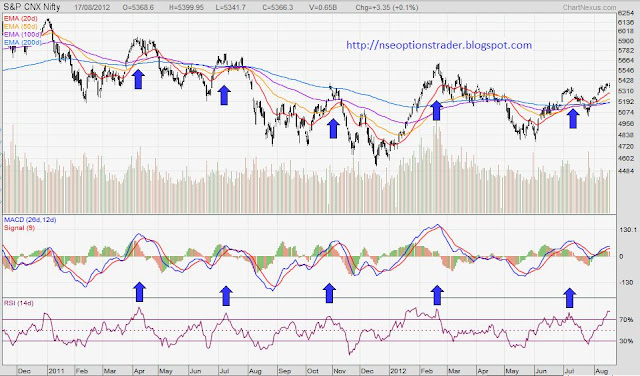
Next, Divergence is used to identify the impending reversal in the trend of the security being analyzed. It usually happens when security makes a higher high (or higher low) but RSI fails to follow through. This is called as Bearish (negative) divergence - First rectangle in the chart below. Vice versa situation where security seems bearish but RSI is going up gives Bullish (positive) divergence and it usually signals things are about to turn positive.


My apologies for not coming up with a better graph which will give a clearer picture but I believe this one will also give the basic idea. Will not be talking about the balance 3 ways to trade RSI but will surely visit them if situation calls for.

I am happy that I was able to follow up yesterday's come back post with this small tutorial kind of post and hope that you will enjoy reading it as much as I enjoyed writing it. RSI is probably one of the most popular oscillator and it will continue to be part of our future discourse so this surely is just the beginning of it. Will think about the third post tomorrow and decide whether to write another tutorial or post some stocks specific charts. If you have any ideas, I am all ears.

 Stay tuned for my (probably) first hat-trick tomorrow. Happy Trading.

RSI Scare

First of all, my most sincere apologies to all of you. Though I wish to... but there is no gain if I spend more time in explaining my absence. I know you are not interested in knowing those reasons behind my absence and would simply want me to get back to writing trading and tutorial posts. So will not bother you more and  get to that straight away.

I had explained some of the scenarios and their meaning in my last post which was two weeks back. Since then we have had two positive weeks and things are extremely interesting now.


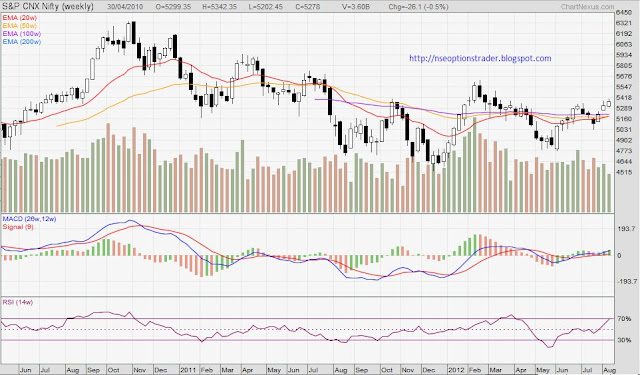
We have created a new peak in last two weeks. Also we have managed three higher lows now on weekly basis. To be honest, I was not expecting the rise in last two weeks. I would have settled for rise of the first week and would have bet against the second week but then such are the markets. This week, I am definitely betting against the similar rise though we may not fall much.

MACD is flat but RSI is nearing the overbought zone as seen above. RSI is much more overbought in daily chart. Have a look below on daily chart. Also worth noting is that RSI in overbought or oversold zone has been very reliable in last two years or so and I have marked instances of RSI overshooting the upper band and subsequent market reaction.


Presently also, as seen above, RSI is in stratosphere and that certainly is not a good sign in short term. Expect some weakness in the NIFTY this week but do not short heavily. Things often get irrational in a strongly trending market in either direction. Otherwise how would you explain last two weeks with virtually no change in fundamentals of companies, Country or World.

Then I cannot help but share good news that I have been promoted after successful completion of my last project. This development in partially responsible for my absence. However after thinking a lot about best way to apologize and make amends with all my readers, I have decided to write three posts on the trot in three days. That was the only thing which came to my mind and hope you would like it too. So I am going to go all out of my way to make sure that you have two more posts in next two days. Will also be back on Twitter in case you want those supports and resistance levels.

Needless to say, will love to hear your comments. Happy Trading.

August 05, 2012

Watta Week

A lot has happened since I made last post a week back.

There was power outages which crippled almost 600 Million people in a rising superpower country. There were blasts in my home town, Pune, in an area which can be very crowded on the eve of Rakshabandhan. There has been RBI meet in last week with only symbolic action coming through. There was a Fed meeting too not very different from RBI. Then we now officially have a drought which further threatens our already paralyzed economy. We have managed a few medals (way less than whats Phelps alone have won) in Olympics.

Let us hope this week brings us some real good news.

I have been trying to write a post every 2-3 days but things have been not working out as well so I will have to manage with what best I can do. Let us see what charts tell us for coming week.


See the weekly chart for NIFTY above. The upward pointing arrows indicate higher highs that we are getting from Jan. If we had got higher highs also, that would have meant some thing but the high of June last week was lower than the Feb and that is where this theory is weakened. Right now also, the coming week is very important and a positive week will give us at least some hope that uptrend is not ruled out completely. However a negative week will leave open the possibility that low of 2 weeks back was not the final low and we may go on to make a low which is lower than the low of June first week. This will almost completely negate the possibility of uptrend.

My reading; we are not out of the woods as yet. At the same time I am also getting a 'feeling' that we may be at the end of this long term bear correction. Usually such long term trends end in high power euphoria (bull) or high despair carnage (bears) which is yet to be seen. That is the reason I don't think we have seen the end of this downtrend. What are we waiting for? May be some kind of shock after all.

Europe, US or even China can bring about that kind of shock which can kill the sentiments and make everyone lose hope. That precisely will be the point to start investing and make merry. If we don't get such bad news from outside, may be we can make Pranab Da FM again. That will certainly qualify.

Will have to make another post soon. It is already half made and won't be long.

Happy Trading. Don't forget the comments.