July 13, 2012

Moving Averages - Final

Finally, final post is here. Moving Averages took longer then expected but I am happy that I did not rush it through and covered all that matters. I hope that you guys are also liking it (sadly your comments or lack of them don't show that) and would be ready for such details. So let us say adios to MAs with this post.

Support and Resistance

MAs also act as Supports in an uptrend and Resistance in a downtrend. As usual short duration MA (20d) acts as Support or Resistance for Short Term trend. Long Term MA like 200D, which is most popular and widely used, acts as Support or Resistance for Long Term trend.


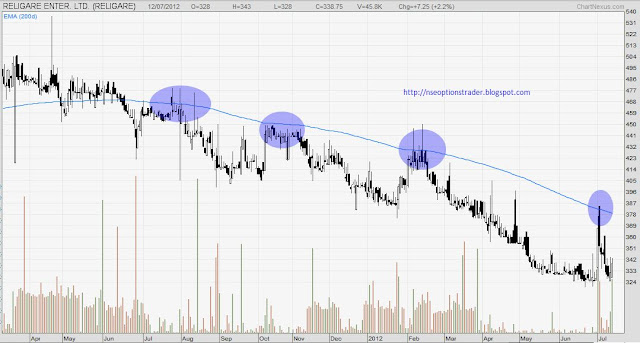
The chart above shows the price taking support at 200 EMA on multiple occasions. After trying three times it finally breaks the support with huge volumes and very decisively on a freak fall day. Such is the strength of 200 MA Support or Resistance. It takes some doing to break it usually.

Let us also see a case where MA line is acting as Resistance. See below;


One thing which many people tend to forget is Market do not work on logic, they work on sentiment and so one should not take Support and Resistance levels from MA lines as rigid. They should think of MA value as a region when Support (uptrend) or Resistance (downtrend) will be present. Little bit of up and down should not be considered as violation of Support or Resistance.

Conclusion

We should remember that Moving Averages are;
1. Lagging Indicators: So you will get signals after prices have already changed
2. Are ineffective in a range bound market 
3. Will not help you buy at bottom and sell at top as they tend to be followers
4. Should not be used alone (in isolation) and they must be supported by other tools / indicators

As I have repeated many times that, with me, there always is a risk of being wrong. So while following this tutorial you are requested to verify its correctness independently... that pinch of salt and all that.

Hope you have enjoyed reading about MAs as much as I have enjoyed writing about them.

Today was a difficult call as I was thinking about doing a post on Infosys / TCS saga and analyse their results. But then I had promised in the last post about finishing MAs quickly and not keep you waiting. Since the childhood I have believed that 'Promise Breaker - Shoe Maker' and honestly I don't have any aptitude in shoe making and I will really be bad at that. So I spared myself and decided for MA. Do let me know what you think though.

July 11, 2012

Moving Averages - 5

Well, the final installment is here guys. Its been almost 3 weeks since we started discussing MAs and it is hard to let go now. But as some philosopher said... life has to go on. Don't be afraid guys, I am not going anywhere. It is just that going through my earlier posts I realized that the humor factor has been absent from my writing these last few months. Effect of the load at office may be. I had become very formal in my writing and it is time that we get that 'Ting' back. So lets start from where we had left in the last post i.e. ways to trade with MAs

Double / Triple Cross-overs

Similar to Price Cross-overs we discussed in the last post, Double Cross-over refers to the cross-over between two MA lines. One of longer duration and one of shorter (obviously, same duration lines cannot cross, no?). As with everything related to MAs, duration of MA lines defines the type of trend (Short term, Medium term or Long term). To cite an example, I would say the 5D and 20D Cross-over would give a short term trend signal. 20D and 50D may be useful for Medium term and 50D with 200D MA line can be used for Long term trend change signal.

A Bullish Cross-over is said to happen when lower duration MA crosses longer duration MA line from below and goes above it. It is also called as Golden Cross. Reverse is when lower duration MA line crossed longer duration MA line from above and it is called as Death Cross.

Again this system produces a lagging signal. Here we are using two MA lines (MA individually is a lagging indicator as we discussed earlier) hence this indicator is further laggard and gives a good signal when a strong and enduring trend change takes place. Otherwise we can get lot of false triggers.


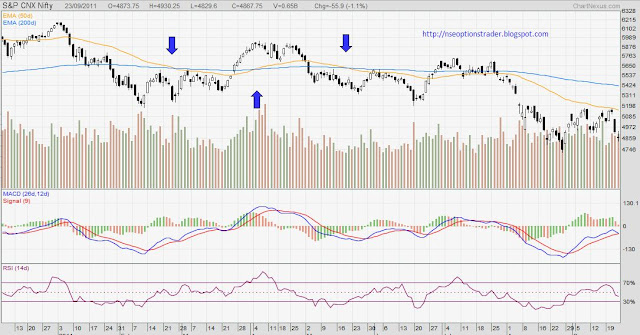
In the above NIFTY chart you will see Medium Term trend changes indicated by 20D and 50D Death Cross and Golden Cross alternatively. You will also notice that these signals appear later as compared to changes in price. One will wonder, what is the use of MAs if they are so late. Actually MAs are used in multiple ways and change in slope of MA lines gives a pretty advance indication and then you also use other indicators/ oscillators in conjunction with MAs to arrive at a trading decision. We will discuss this in details at the right time.

See another chart;


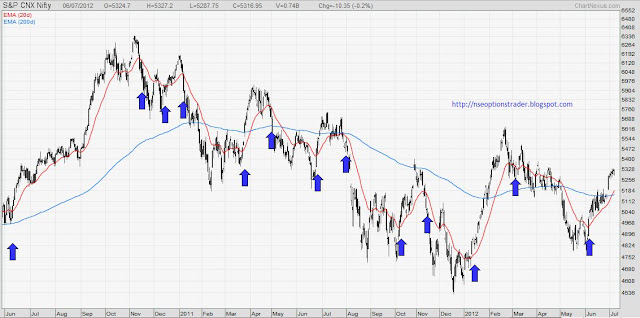
What you see above is again NIFTY chart with longer duration MA line and as you see you are getting multiple false triggers here. How do we get past these? There are two ways. First, depending on the duration of the MA lines you can give some cooling period to Cross-over e.g. for 5D, 20D lines you may decide that you will wait for 3 days after the Cross-over to confirm it. Second, as I said earlier you can use other corroborating evidence. In this case specially, you can use MACD which turns positive during Golden Cross and negative in case of Death Cross. More on this at the right time.

When you use three MA lines with lower duration MA line crossing the other two it is called as Triple Cross-over.

I thought this will be last post in MA series but looks like I will have to come back with another one for last trading strategy as this post has gone longer than I anticipated. Next trading strategy may also stretch like this so I will not take risk to start it here. Apologies guys but you will not have to wait for long, promise. Happy trading.

July 08, 2012

Moving Averages - 4

I am back with the next post in MA series. We have already seen what MAs are, types of MAs, what are the popular durations and their significance. What remains to be seen as how do we find trading signals using MAs. So lets get on with that.

There are various ways to use MAs (Simple as well as Exponential) for trading purpose. We will list them down and elaborate one by one.

1. Trend Identification
2. Price Cross-overs
3. Double/ Triple Cross-overs
4. Support and Resistance

One common thing here is that shorter the duration of MA the more volatility you will see in each of the above signals. Also short term MAs are useful for short term trends. Longer the duration, more reliable signals and they will indicates long term trends. Here MA indicates both Simple as well as Exponential MA and as I said in the last post it depends on your own comfort level. You can use anyone.

Trend Identification

The direction of the MA indicates general movement in prices. A rising MA indicates increasing price and a falling MA denotes generally decreasing price. This works well in case of medium to long duration MAs and in case of lower duration (5d, 10d) you may see too many direction changes. See the chart below;


You will see so many direction changes in 20 EMA while hardly any movement in 200 EMA. So for a short term duration, change in the direction of MA can give some signal but you need to choose duration well. A change in the direction of long duration MA signals a change in long term trend.

Here one thing to remember is MAs are lagging indicators so they will give signals when Price has already made the move and not beforehand. On a very short term basis this increases the chances of false triggers.

Price Cross-overs

MAs are used for trading signals by using Price Cross-overs where prices move above or below the MA line. So when price moves above a MA line or crosses it from below, it generates a bullish signal. Reverse is true for bearish signal when prices crosses MA line from top and goes below it.


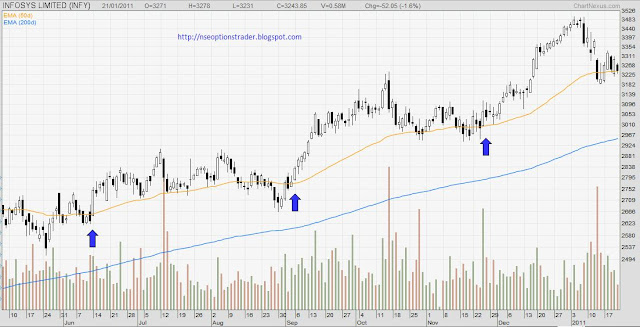
One thing to remember here is you use this signal when long term trend is also in the direction of your trade. To cite an example, if price crosses 50 EMA from below and goes above it you would want to trade bullish but make sure that price is also above larger MA (100 or 200) in such case. Rational is that the long term trend is intact (bullish) and price came below 50 EMA as part of normal pull back and will continue to go up.

See the INFOSYS chart above where price continues to be above 200 EMA but crosses over 50 EMA few times without violating the long term trend. Gives good short to medium term gains.

Will write the final (5th) post in MA series soon. Before I sign off, have two things to share.

First, my project is officially over and I was partying in Lonavala this weekend with the office group. That place can beat any holiday destination in monsoon. Simply awesome. Enjoyed fully and hence could not write more. Second thing, one of the reader of the blog, 'Legend' send me all the posts of the blog compiled in a word file and it was very satisfying to go through everything I have written over last one year or so. Deepest thanks to Legend.

Will be back soon. Comments, as usual, will act as catalyst.