Well, the final installment is here guys. Its been almost 3 weeks since we started discussing MAs and it is hard to let go now. But as some philosopher said... life has to go on. Don't be afraid guys, I am not going anywhere. It is just that going through my earlier posts I realized that the humor factor has been absent from my writing these last few months. Effect of the load at office may be. I had become very formal in my writing and it is time that we get that 'Ting' back. So lets start from where we had left in the last post i.e. ways to trade with MAs
Double / Triple Cross-overs
Similar to Price Cross-overs we discussed in the last post, Double Cross-over refers to the cross-over between two MA lines. One of longer duration and one of shorter (obviously, same duration lines cannot cross, no?). As with everything related to MAs, duration of MA lines defines the type of trend (Short term, Medium term or Long term). To cite an example, I would say the 5D and 20D Cross-over would give a short term trend signal. 20D and 50D may be useful for Medium term and 50D with 200D MA line can be used for Long term trend change signal.
A Bullish Cross-over is said to happen when lower duration MA crosses longer duration MA line from below and goes above it. It is also called as Golden Cross. Reverse is when lower duration MA line crossed longer duration MA line from above and it is called as Death Cross.
Again this system produces a lagging signal. Here we are using two MA lines (MA individually is a lagging indicator as we discussed earlier) hence this indicator is further laggard and gives a good signal when a strong and enduring trend change takes place. Otherwise we can get lot of false triggers.
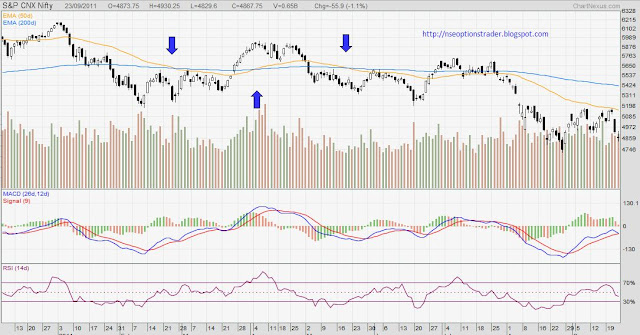
In the above NIFTY chart you will see Medium Term trend changes indicated by 20D and 50D Death Cross and Golden Cross alternatively. You will also notice that these signals appear later as compared to changes in price. One will wonder, what is the use of MAs if they are so late. Actually MAs are used in multiple ways and change in slope of MA lines gives a pretty advance indication and then you also use other indicators/ oscillators in conjunction with MAs to arrive at a trading decision. We will discuss this in details at the right time.
See another chart;

What you see above is again NIFTY chart with longer duration MA line and as you see you are getting multiple false triggers here. How do we get past these? There are two ways. First, depending on the duration of the MA lines you can give some cooling period to Cross-over e.g. for 5D, 20D lines you may decide that you will wait for 3 days after the Cross-over to confirm it. Second, as I said earlier you can use other corroborating evidence. In this case specially, you can use MACD which turns positive during Golden Cross and negative in case of Death Cross. More on this at the right time.
When you use three MA lines with lower duration MA line crossing the other two it is called as Triple Cross-over.
I thought this will be last post in MA series but looks like I will have to come back with another one for last trading strategy as this post has gone longer than I anticipated. Next trading strategy may also stretch like this so I will not take risk to start it here. Apologies guys but you will not have to wait for long, promise. Happy trading.

looks to be quiet a informative blog ... kudos ,, keep up the good work
ReplyDeleteNice post didi... waiting for next one
ReplyDelete