July 29, 2012

I still hate IT Returns

And I will continue to hate IT Returns. But that is for next year, at least for this year I am through with them. It is a relief and I can say that next year it will be a cake walk unless new FM changes something and brings up new so called 'Saral' form to make returns 'Simpler'.

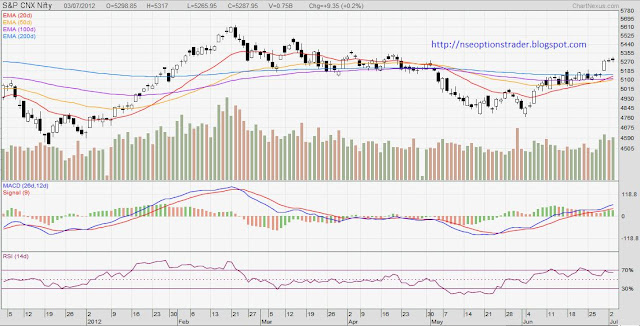
Then in a related development my usual charting software has gone bonkers and I was trying to get it back up online through today. Failed; so you will see a different chart today.


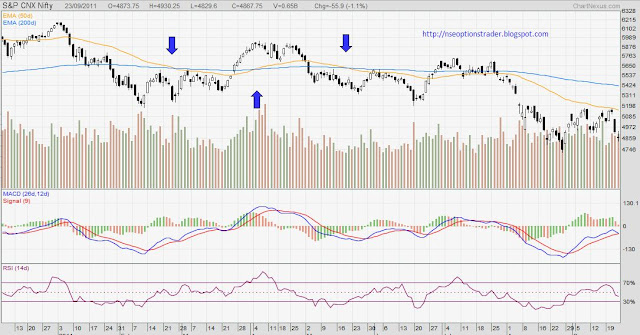
The chart is slightly different than usual but I am sure you will not find it difficult to read. It lacks few functionality but will make do for some time. The interesting thing to see on the chart is the close proximity of 50DMA and 200 DMA. We are inching towards a Death Cross and it can be confirmed only after it lasts for a few sessions.

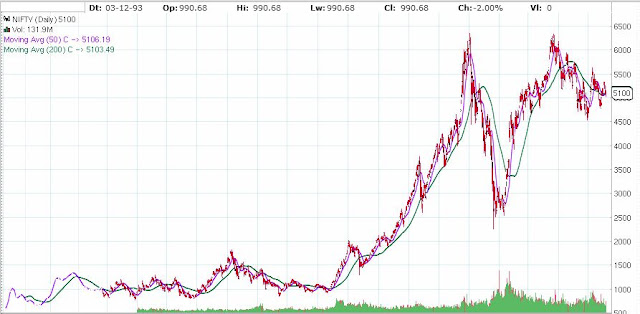
I will reiterate that in my opinion we are still in a bear market which is seeing counter trend rallies in between. Out trading horizon is usually less than 4 weeks and hence we have to mind the short as well as medium term trends and factor them in our trading decisions. It may be little difficult to believe we are in long term bear market looking at the chart above so may be our perspective will be clear if we see the chart of long term.


If you see this chart on a weekly or monthly basis things become a lot more clear. I expect some weakness in the market even in next four weeks but I am not sure about the magnitude of the move. It may not be as violent as in the last series. We may see some downward move followed by a rally and then some consolidation in the new trading range before a break out. That will be a good point for us to make some investment (not trading) decisions.

Have to study few more things in details before I can make a sound trading call. It may be simply buy/sell trade or I may work out some 'Spread' kind of trade to reduce the risk. Will try to make that post very soon but have to get some idea or some news from Europe/US to make it worthwhile.

Finally I have made up my mind regarding tutorials also so will be back with that as well. Will try to start that tomorrow itself if trading scenario is not clear. Lets hope for best. Happy trading till then.
July 24, 2012

I hate IT Returns

No kidding... the whole system of filing your IT Returns is so cumbersome that I really hate it. Primary reason for that is I have vowed not to take help of my family CA this time and decided to file it online. In the whole value chain everyone is hell bent on making your life terrible. Right from the company giving you Form 16, Banks giving you Form 16A, Broker giving you Trading Statement and P&L account... everything is so full of jargon that by the time you read them completely you have a splitting headache. It would have been so much easy to just know the amount you need to pay... pay it and sleep well. But Alas. The whole system with all (earstwhile) Saral and now ITRs is so unfriendly that you wonder whether it is made for helping residents pay tax or otherwise. The CAs are a happy lot in any case.

Ok, after this ranting, I am feeling a lot better and lighter. Now we can come back to our Blog. My apologies for taking off without any prior notice. Went to my native in Konkan for chilling out and got entangled in IT Returns after coming back. Still not over but should be done with it by tomorrow I guess.

I went through your comments and mails and can conclude that you guys want to know about RSI/MACD and Futures. I also have my own ideas but I will keep them aside for the time being and see how I can attend to your wish. I will have to make it a lot more structured this time though so it may be a couple days before I start on with tutorials again.

Meanwhile, I hope those of you who got in to 5300 PUT and some of you who preferred 5200 PUT are not disappointed. I guess you must have got good returns for your investment. This is an expiry week and though one may tend to expect volatility, the experience of last expiry was totally different. Even now, Volatility Index, VIX is at a record low and hence Option Premiums are not very high. You can have a look at it here. It is right now lower than 19 from highs of 30+. No place of high Beta stocks at the moment. Will explain this later.

At the moment, will post the NIFTY Chart before signing off. I am posting a weekly chart this time as it will help me make my point better.


As I have mentioned in earlier post that higher highs and higher lows is the first sign of Bull Market. On a weekly level we have one higher high and one higher low already. However it was in any case foolish to think that Markets are in an uptrend with all the macro-economic factors in mess, turmoil in West and a plethora of negative news from everywhere. Rightly so, we have seen Lower High and the high of June is lower than the high of Feb. Now if the Market breaches Low made in April then the picture becomes very clear. We already have all EMAs taken out by the market convincingly and MACD/ RSI are also not offering any hopes. I would bet on Markets breaching 4800 soon but you guys, hold your horses and do not rush in to trades as I need to be back this hypothesis with a better reasoning.

I will write more about it when I write the trading post for August series. Have a Happy IT Return filing till then. Have tweeted about Supports and Resistance too.

July 23, 2012

Break Over

Hi all, I took a voluntary break from reading, writing and trading. There was no reason but just to get away from things so that I can come back fresh.

And fresh I am now. Have gone through your comments and mails and will write soon. Hope you guys had fun too.

July 16, 2012

What Next?

So, Moving Averages is read and done with... I have not received any questions or queries so I take it that you have understood it well. So what do you guys want next? There are so many topics and so many indicators/ osciallators and patterns that I am totally confused what to start now. So this time I will want to know which is the topic that interests you in Technical Analysis. Do let me know through your comments and mails as to what is it that you are interested in reading now. I will try my best to write about it.

As for our trade of 5300 PUT if any of you have entered then I hope you are not disappointed. If you are still in the trade then there are more gains to make. Enjoy.

I have tweeted about Support and Resistance levels for tomorrow and will try to do it everyday. Will wait for your comments before starting next topic.

July 13, 2012

Moving Averages - Final

Finally, final post is here. Moving Averages took longer then expected but I am happy that I did not rush it through and covered all that matters. I hope that you guys are also liking it (sadly your comments or lack of them don't show that) and would be ready for such details. So let us say adios to MAs with this post.

Support and Resistance

MAs also act as Supports in an uptrend and Resistance in a downtrend. As usual short duration MA (20d) acts as Support or Resistance for Short Term trend. Long Term MA like 200D, which is most popular and widely used, acts as Support or Resistance for Long Term trend.


The chart above shows the price taking support at 200 EMA on multiple occasions. After trying three times it finally breaks the support with huge volumes and very decisively on a freak fall day. Such is the strength of 200 MA Support or Resistance. It takes some doing to break it usually.

Let us also see a case where MA line is acting as Resistance. See below;


One thing which many people tend to forget is Market do not work on logic, they work on sentiment and so one should not take Support and Resistance levels from MA lines as rigid. They should think of MA value as a region when Support (uptrend) or Resistance (downtrend) will be present. Little bit of up and down should not be considered as violation of Support or Resistance.

Conclusion

We should remember that Moving Averages are;
1. Lagging Indicators: So you will get signals after prices have already changed
2. Are ineffective in a range bound market 
3. Will not help you buy at bottom and sell at top as they tend to be followers
4. Should not be used alone (in isolation) and they must be supported by other tools / indicators

As I have repeated many times that, with me, there always is a risk of being wrong. So while following this tutorial you are requested to verify its correctness independently... that pinch of salt and all that.

Hope you have enjoyed reading about MAs as much as I have enjoyed writing about them.

Today was a difficult call as I was thinking about doing a post on Infosys / TCS saga and analyse their results. But then I had promised in the last post about finishing MAs quickly and not keep you waiting. Since the childhood I have believed that 'Promise Breaker - Shoe Maker' and honestly I don't have any aptitude in shoe making and I will really be bad at that. So I spared myself and decided for MA. Do let me know what you think though.

July 11, 2012

Moving Averages - 5

Well, the final installment is here guys. Its been almost 3 weeks since we started discussing MAs and it is hard to let go now. But as some philosopher said... life has to go on. Don't be afraid guys, I am not going anywhere. It is just that going through my earlier posts I realized that the humor factor has been absent from my writing these last few months. Effect of the load at office may be. I had become very formal in my writing and it is time that we get that 'Ting' back. So lets start from where we had left in the last post i.e. ways to trade with MAs

Double / Triple Cross-overs

Similar to Price Cross-overs we discussed in the last post, Double Cross-over refers to the cross-over between two MA lines. One of longer duration and one of shorter (obviously, same duration lines cannot cross, no?). As with everything related to MAs, duration of MA lines defines the type of trend (Short term, Medium term or Long term). To cite an example, I would say the 5D and 20D Cross-over would give a short term trend signal. 20D and 50D may be useful for Medium term and 50D with 200D MA line can be used for Long term trend change signal.

A Bullish Cross-over is said to happen when lower duration MA crosses longer duration MA line from below and goes above it. It is also called as Golden Cross. Reverse is when lower duration MA line crossed longer duration MA line from above and it is called as Death Cross.

Again this system produces a lagging signal. Here we are using two MA lines (MA individually is a lagging indicator as we discussed earlier) hence this indicator is further laggard and gives a good signal when a strong and enduring trend change takes place. Otherwise we can get lot of false triggers.


In the above NIFTY chart you will see Medium Term trend changes indicated by 20D and 50D Death Cross and Golden Cross alternatively. You will also notice that these signals appear later as compared to changes in price. One will wonder, what is the use of MAs if they are so late. Actually MAs are used in multiple ways and change in slope of MA lines gives a pretty advance indication and then you also use other indicators/ oscillators in conjunction with MAs to arrive at a trading decision. We will discuss this in details at the right time.

See another chart;


What you see above is again NIFTY chart with longer duration MA line and as you see you are getting multiple false triggers here. How do we get past these? There are two ways. First, depending on the duration of the MA lines you can give some cooling period to Cross-over e.g. for 5D, 20D lines you may decide that you will wait for 3 days after the Cross-over to confirm it. Second, as I said earlier you can use other corroborating evidence. In this case specially, you can use MACD which turns positive during Golden Cross and negative in case of Death Cross. More on this at the right time.

When you use three MA lines with lower duration MA line crossing the other two it is called as Triple Cross-over.

I thought this will be last post in MA series but looks like I will have to come back with another one for last trading strategy as this post has gone longer than I anticipated. Next trading strategy may also stretch like this so I will not take risk to start it here. Apologies guys but you will not have to wait for long, promise. Happy trading.

July 08, 2012

Moving Averages - 4

I am back with the next post in MA series. We have already seen what MAs are, types of MAs, what are the popular durations and their significance. What remains to be seen as how do we find trading signals using MAs. So lets get on with that.

There are various ways to use MAs (Simple as well as Exponential) for trading purpose. We will list them down and elaborate one by one.

1. Trend Identification
2. Price Cross-overs
3. Double/ Triple Cross-overs
4. Support and Resistance

One common thing here is that shorter the duration of MA the more volatility you will see in each of the above signals. Also short term MAs are useful for short term trends. Longer the duration, more reliable signals and they will indicates long term trends. Here MA indicates both Simple as well as Exponential MA and as I said in the last post it depends on your own comfort level. You can use anyone.

Trend Identification

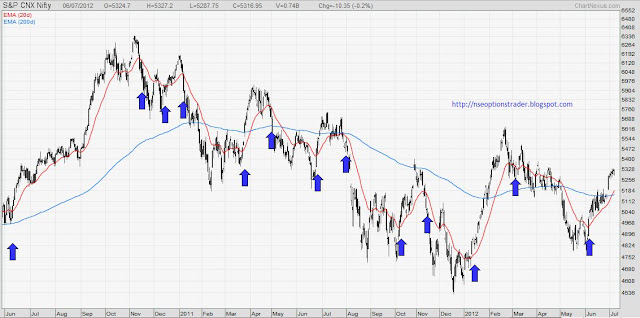
The direction of the MA indicates general movement in prices. A rising MA indicates increasing price and a falling MA denotes generally decreasing price. This works well in case of medium to long duration MAs and in case of lower duration (5d, 10d) you may see too many direction changes. See the chart below;


You will see so many direction changes in 20 EMA while hardly any movement in 200 EMA. So for a short term duration, change in the direction of MA can give some signal but you need to choose duration well. A change in the direction of long duration MA signals a change in long term trend.

Here one thing to remember is MAs are lagging indicators so they will give signals when Price has already made the move and not beforehand. On a very short term basis this increases the chances of false triggers.

Price Cross-overs

MAs are used for trading signals by using Price Cross-overs where prices move above or below the MA line. So when price moves above a MA line or crosses it from below, it generates a bullish signal. Reverse is true for bearish signal when prices crosses MA line from top and goes below it.


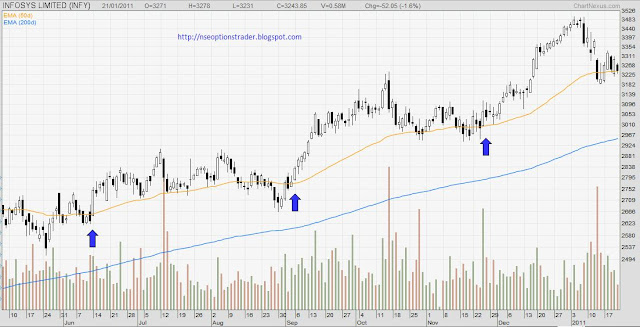
One thing to remember here is you use this signal when long term trend is also in the direction of your trade. To cite an example, if price crosses 50 EMA from below and goes above it you would want to trade bullish but make sure that price is also above larger MA (100 or 200) in such case. Rational is that the long term trend is intact (bullish) and price came below 50 EMA as part of normal pull back and will continue to go up.

See the INFOSYS chart above where price continues to be above 200 EMA but crosses over 50 EMA few times without violating the long term trend. Gives good short to medium term gains.

Will write the final (5th) post in MA series soon. Before I sign off, have two things to share.

First, my project is officially over and I was partying in Lonavala this weekend with the office group. That place can beat any holiday destination in monsoon. Simply awesome. Enjoyed fully and hence could not write more. Second thing, one of the reader of the blog, 'Legend' send me all the posts of the blog compiled in a word file and it was very satisfying to go through everything I have written over last one year or so. Deepest thanks to Legend.

Will be back soon. Comments, as usual, will act as catalyst.

July 04, 2012

So Near yet so Far

Today 5300 PUT Option Premium reached 70.20 but yet did not go below 70. I had placed an order in the morning for 70 and then did not get time to check it again. Right now I am not sure whether I should be happy or sad. Given that the US Markets are closed for Independence Day holiday and closing price of 5300 PUT around 75-76 I think we may just about get my target entry tomorrow.

However, with every passing day the probability of a upward spike in NIFTY is waning. Similarly the time remaining for NIFTY to make down move is also reducing and so is our risk.

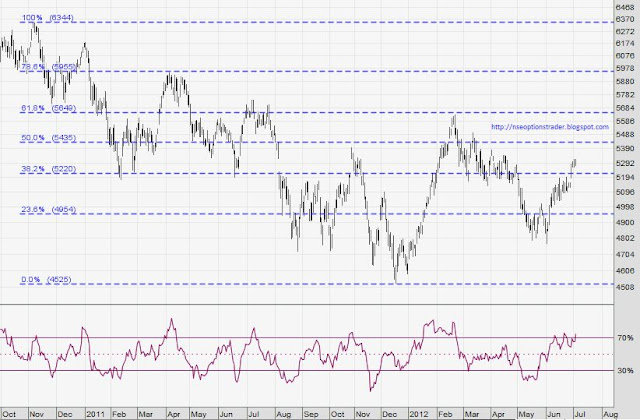
Have a look at the chart:

If you see the peak made sometimes in Nov 2010; from then it has been a free fall with lower highs and lower lows. This is first rule of finding trend. This continued till around Dec of last year when Market was about 4500 from where it took off to above 5000. Now here Market violated  the earlier High and it went above that. After that came correction but it did not go below earlier low in May-June of this year. From there we are again going up. This picture become a lot clear if you see the weekly chart.


Fibonacci levels for this move are also plotted. Fibonacci is one of my favorite topic and I could discuss that for hours. I am really clueless how I am gonna write about it during Tutorials but it will be very interesting I am sure.

Short term view, markets are stretched above all EMA levels as well as fundamentally not much has changed to warrant this rally (apart from new FM and few positive announcements). Few broker houses have given positive reviews for India equities in recent days but that is it. Nothing has changed fundamentally for World or for India barring probably the sentiment. All in all we should see some correction. Technically I am not able to come up with any indicator which is telling me that the fall is imminent. We are hardly in overbought condition. MACD is not giving any sell signal and even Fibonacci levels are not conclusive.

In such scenario, it is worth thinking that whether we should take one sided call and buy only PUT Option betting for the fall. I probably have to study S&P 500 Index of US more closely as that is the one which affects us more directly. Will have to do a lot deeper analysis but in the meantime will stick to earlier stated position and will buy PUT call if opportunity is there. Though I may reduce the entry point (risk) a bit given the information in this post. Let me know what you think. Happy Trading.

July 03, 2012

Trade Post and Comments

Thanks guys for your comments. However I did not mean that you write 'thanks' comments. What I meant and expected is that you guys also contribute to the discussion. Not necessarily by some new information but by way of questions, critical comments. You can also write what do you think about the charts I post. You can also write if you have questions about some particular stock or index. Most importantly you can let me know how do you want this blog to shape up.

Idea is, I am not a professional blogger and I just pen down my thoughts in a haphazard manner. There is no order, no sequence and no one to look at the larger picture. You guys are the observers and you can guide me if something is not right. So write something on that line. I actually never thought, but this blog, if made properly, can be a good starting point for many people. This may not happen overnight or in few weeks but if I continue to write for whatever time I am spending now then may be in a few months or in a years time, this blog can be a good resource for many new starters. You guys can help me in it.

As for the trading post, then Markets did not go up for Euro Summit outcome as everyone believed. I also expected some sort of minor rally at least; before a correction of our liking happens. The time has not run out still. US markets are slightly up as of now and we may see some sort of spike in our market too before we get some retracing.


Today morning I tweeted about 5300 PUT being below 80 (it is updated on blog page automatically). I would have planned an entry around 70 level but sadly it did not come today. I believe we may still get that chance. If not and if you want to open a position quickly, 5200 PUT is also good option. Current level is about 50 and Risk for a lot would be limited to around 2500 Rs. Not bad.

Will write MA post and how to trade with them soon. Happy trading and keep commenting.

July 01, 2012

Attempted Trading Post

Hello friends, my apologies for not being able to make post 4 of Moving Averages. Been busy this entire weekend. However I am trying to at least keep the second post promise and though I have not got sufficient time to look at the charts in details, I am just posting what I think will unravel in the July series.

What a start we had for July series on Friday. Few would have expected (including me) that markets will cheer so much the announcements from new FM. As I had mentioned in last post that MMS (ManMohan Singh) had made all the right noises and even the clarity on few announcements by PranabDa will help. Also Euro Summit happened over the weekend and though I would have loved to make a detailed post on it's outcome the time is not on my side. In a nutshell, many people think (in Europe) that out of 20 odd Europe Summits so far since the problem started, only this summit probably not only met but also exceeded the expectations. Now, me thinks, the primary reason for this is the inherently low expectations that everyone had this time. Also though Angela Merkel was vocally against shared liability of Eurozone debt, she also understands that there are not many options left. Anyways what happened in Brussels is expected to prop up the markets at least in the short term so expect another rally tomorrow.

As for the trading; I believe that though we may see the rally in equities to continue, it may be short lived. If I have to trade, I would probably wait for the market to go up tomorrow and would like to bet on to a correction. This definitely carries a risk that market may continue to go up. It also carries the risk that the correction may not happen in time for July series.


The best way to cut risk is to buy a PUT Option at 5300 or 5400 Strike if you agree with my thinking. Right now 5300 Put Option is around 105 Rs and 5400 Put Option is around 160. I will probably wait for markets to gain tomorrow so that these prices drop and depending on the level of the markets and price of these two Option will do a quick break-even calculations and based on my risk appetite get in to one of them. Needless to say Options is a risky business and will not play it beyond my risk money.

Please note that this is not a investment or trading advice. It is only my personal thought process on what I would do if I trade tomorrow. I have been wrong more often than not and lost money. Please do not treat this as an advice and do not blame me for your decisions.

Finally, I would like to say that I am really really disappointed that no comments on my earlier post. Probably that is also one of the reason I could not write MA post 4. So this time do not let me down and let me know what you think of this post. Also its been long that I took any feedback from you guys so it would be great if you can let me know if you want any changes in the way this blog is shaping up. Will be waiting for your suggestions. Happy trading.

Disclosure: Been very busy so may not get time to trade at all. Right now I do not have any trading positions open.