June 28, 2012

Welcome New FM

I am too tired to make a long post hence resorting to something of manageable size. Moreover making trading post or last part of MA posts will need lot of writing and probably many charts and I have no energy left for that. Still I think tomorrow or day after I would be able to make part 4 of MA and then on Sunday I will make a trading post. This time, even if I do not get a clear trade, I will still post what I think will happen with the assumptions and also what risk it poses. That should qualify as trading post. Rest you guys will decide and let me know through your comments.

Today was expiry day but still the markets did not move a total of even 1% in entire day. So much for expecting volatility on expiry day. This move does not mean that everything is calm and stable. Market simply appears to be cautious ahead of the two day EU Summit that begins today in Brussels. Though one cannot be too optimistic about outcome of this summit due to opposing views of EU leaders and too many undercurrents but more and more the summit appears to be Angela Merkel (Germany) Vs the Rest of the Europe. It is correctly so because whatever the cost of saving Europe most of it has to be paid by Germans. You can read about it here.

Then as I had expected, Manmohan Singh (MMS as I call him) started acting as soon as he took charge of Finance Ministry. Though not exactly any Earth shattering announcements, he made all the right noises. However what really is encouraging is his readiness to roll back some of the archaic announcements of last General Budget. Particularly sweet sounding to the ears of FIIs will be the rollback of GAAR (General Anti Avoidance Rule) which targeted Vodafone but spooked entire FII community. I personally would have preferred if somehow Vodafone was made to pay but the cost of going after them is too much. Sometimes it is better to loose a battle if it helps us win ultimately.

Another important step could be the clarification regarding taxation on P-Notes (Participatory Notes). Rather than changing all or rolling back all these policies, if MMS can only bring clarity about them in short time, he would have started well as FM me thinks. This is one area where he is comfortable as been there done that in 1991 and I hope he weaves his magic once again. We have problems but none of them insurmountable and fortunately we have a FM at the helm who knows all too well how to do that. If he addresses policy clarity issues, he will have more air to breath while tackling structural issues.

As for the market, we are delicately balanced at 200 EMA and are free to go either way and outcome of EU summit will play a role in NIFTY direction at least in next week. Will post about that on Sunday for sure. Waiting for your comments till then. Happy trading.

June 27, 2012

Moving Averages - 3

I am back. Did not think that I will be able to write again before weekend but God has been kind. So without wasting your time, will continue our Moving Averages tutorial.

In the first two parts we have seen what are MAs and popular types among them. I will resist the urge to get in to other types of MAs as honestly that will just be a general knowledge without any practical use for trading. So as discussed, we will see which duration we should use, which type and why?

Duration:

Most simply put, duration depends on what kind of view you need about the direction of the market. In other terms, if you are looking at short term trend or you are a trader you will use MAs of lowest duration like 5 day, 10 day or 20 day. If you have a horizon of medium terms (few months) you will be more interested in 50 day kind of MA and if you are a long term investor, your choice would be like 100 day or 200 day MA.

200 day EMA is probably the most popular among all. It is a very long duration MA and usually a strong and reliable indicator of trend, change in trend. It also usually is a strong support or resistance. Medium term investor prefer 50 day MA and short term trader 5 or 10 day duration.

Short duration MAs are very agile and they adapt to price very fast. You will see a change in them even with a single day large move. Long term duration MAs are lethargic. They tend to be very smooth and usually do not get affected by short term volatility. See the self explanatory chart.


Type:

Another normal dilemma is which type of MA to use. Simple MA (SMA or DMA) or Exponential (EMA)?

To be fair, none is better than the other. EMAs give more weight-age to recent prices hence quicker to react. SMAs are simple and represent true average of period under consideration. Usually SMAs are more reliable while indicating Supports and Resistance Levels and EMAs give an early indication of change in Trend.


As you can see in above chart, 50 EMA straightens out before 50 SMA as shown in first oval. At second instance also, 50 EMA starts to drop before 50 SMA.

Here I would like to make one thing clear that one should try various duration, types of MAs depending on one's objective, time horizon, investing style and comfort level. As I have mentioned in some earlier post that I am more comfortable with EMAs, similarly you should find out your own preference.

This now leaves one last post (I am not sure if I will be able to cover everything in one post) about how to trade using MAs. I will write more than one post if it becomes too long to cover all of it in one go. Just wishing that I get the time to do so quickly.

Keep the comments flowing.

June 24, 2012

Charts

As promised I had started preparing for trading post but could not find a clear cut trade for the week. There were too many uncertainties and assumptions which were greatly diminishing the risk to reward ratio. I though after so many days if I am doing any trading post, I should be slightly more convincing. Another factor is this being expiry week, volatility may be little high for our comfort. So I decided against writing the trading post.

However, I did not want to go back to continuing MA post and was in mood to post some charts anyway. So I decided to improvise the trading post a little. Here I am posting charts of some very popular NIFTY components. Again the commentary is minimum.

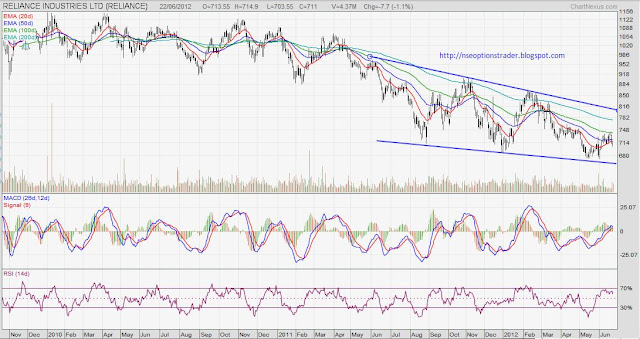
Reliance:


You simply cannot skip RIL when talking about NIFTY. This stock used to be the single biggest factor in deciding NIFTY direction not long ago. However presently there is not much to say here. As you can see the stock is in clear downtrend in the channel. The channel has just intensified and this in spite the fact that there is an active buy back is in the progress. It was never my favorite and certainly isn't one right now.

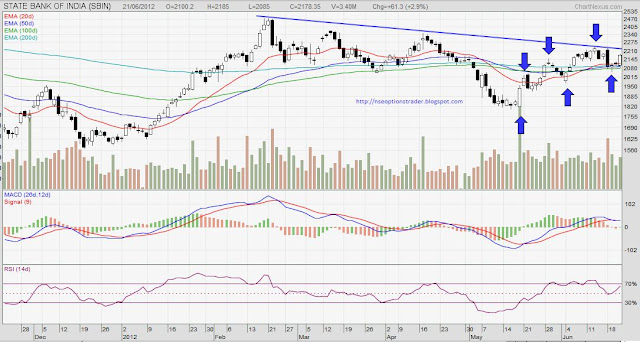
State Bank of India:


This is the Indian bellwether of probably the most important sector in the World right now... Banking. This stock is a direct barometer of health of Indian Banking system though sometimes it has to bear the brunt of being a Public Sector Bank. As you can see, recently as a very short term level it has started creating higher highs and higher lows (This is the first principle of checking uptrend). But this is very short term and there is a strong resistance at the top marked by the trend line. Unless it decisively breaks that, I wouldn't go long in a hurry. In any case, Banking sector as a whole has just too many uncertainties these days and it is affected not only by RBI but ECB/FED and bond yields of even tiniest European countries. Only a brave heart will take a long term position here.

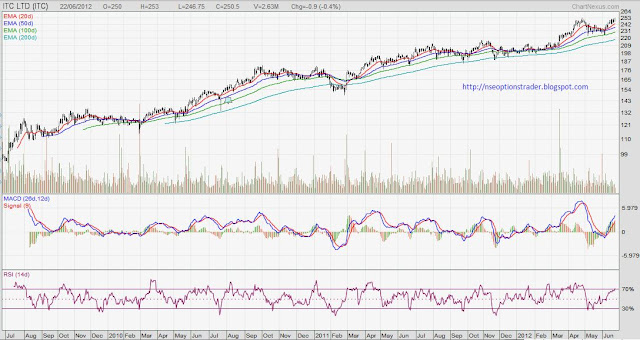
ITC:


Isn't it a beautiful chart. Has been going up consistently in spite of increased taxes on Tobacco items. ITC actually is a very diversified company from Hotels, FMCG to what not and it is very very difficult to find the fair value of this stock by fundamental method. Though the slope of the rise is not extraordinary the consistency of the rise in a volatile market is worth a note. It is just about to approach over bought condition and might see a piddly correction. This stock is for someone who is an investor and less for a trader.

Hope you will excuse me for not making a trading post and have enjoyed the charts here. Will get moving with the next post on Moving Averages and will also keep my eyes open for any suitable trading post. Keep the comments coming, they help me get back to writing.

Disclosure: No live trading position in any of the above stocks. Have a small no of RIL shares which are held since few years without any short term interest.

Moving Averages - 2

Lets continue our Moving forward journey. I will now site examples from the market and related fields only to make it clear.

Simple Moving Average

It is as simple as it sounds. In case of NIFTY, you take the closing values of last as many days as you are interested in, add them up and divide the total by no of days. Simple? No. Simple Moving Average.
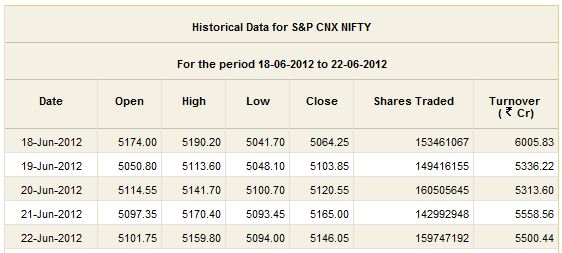
So if you take NIFTY closing of last 5 days;
5 day Simple Moving Average value would be - 5119.94. You can do it yourself. SMA is sometimes also called as DMA where D stands for days. So 5 DMA means 5 days Simple Moving Average.

Weighted Moving Average

A small discussion about Weighted MA will help us understand Exponential MAs better so here it is. In a data which runs for many months and years sometimes it is not very difficult to consider that as the reading gets older and older its importance for the present data goes on decreasing. In other terms; NIFTY closing value of 3 months back can have much less bearing on current level tomorrow when you compare with the last closing of NIFTY.

If it fits in to judgement that the more latest value the higher relevance it would have on the future value then you need to factor this in the MA calculation. This is where the Weighted Moving Average makes the entry. In WMA, the recent entries are multiplied by a factor which goes on reducing for the earlier readings and goes to 1 at the last reading. IN more simple example, for 5 day WMA you would multiply latest reading by 5, next reading by 4 then by 3 and so on. Finally you will add up everything and divide the total by 5+4+3+2+1 (total of multiplication factors). It gives you WMA. Using this method, WMA in above example it would be - 5134.92.

Exponential Moving Average

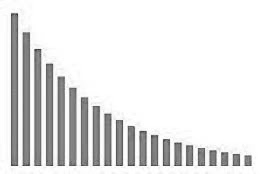
As if the WMA was not sufficient, some genius came up with the idea that the Weight of each reading should not decrease linearly. He/She thought that the latest readings should carry higher weight and it should drop faster as you go towards earlier readings. Enter the Exponential MA. So in case of EMAs the weight factor drops faster as readings grow older. Graph will give you some idea; 
It may be difficult to calculate EMA so easily but every charting tool gives you this functionality so you don't really have to get on calculator or excel to find out EMA.

Now the real question is, which one you should use and for which duration. Also how does it helps us in trading. There you go, I have my next two posts lined up here. We will see which one to use, which duration, and why in next post and then we will see how to use MAs for trading in the post after that. Let me know if you are liking it.

Moving Averages

I am back with another tutorial. Actually I thought of writing some trading post but then with the kind of comments I am getting, I guess you guys are looking forward to more tutorials. I still could have gone for some trading post but then anything can happen in Europe even on Sunday and it can make my post look stupid. So I decided to wait as anyways I am not sure if I can find some worthwhile trade in the present condition.

As I had said, I will start with Moving Averages as they are by far the most commonly used Technical Indicators.

We all understand what does Average mean? It is simply the mean value of a given set of data. Mathematically you add up all values/quantities and then divide the total with no (count) of values/quantities. It is clear to most of us till this point. So what then does a Moving Average (MA) mean? Well, when you have a long set of data and you make a subset of this data and calculate its Average on continuous basis, it is called as Moving or Rolling Average.

Let us say that I start noting the time taken to reach office everyday. I calculate the monthly average when I have 30 readings (I have really been going to office almost everyday these past 30 days). It will be Average time taken to reach office. Now when I have 31st reading, I can calculate Average time to office for last 31 days or I can still calculate the 30 day average but this time I will drop the very first reading and include 31st reading in the data. Similarly on 32nd day, I will drop first and second reading and include 31st and 32nd reading. So I will always be calculating Average time taken to reach office for last 30 days. Everyday I will add the new reading and take 30 readings backwards from that day and exclude all earlier readings. Bingo... it is 30 day Moving Average. The MA value keeps changing (moving) with the time and it gives my Average for last 30 days all the time.

This makes sense because for many markets we have data from 1960s or 1970s. If we take Average of this data for such long duration, it does not help much. Hence we take Moving Average of different duration like 5 days, 10 days, 20/21 days, 50/100/200 days depending on how much short term or long term we want to look at. We will see the significance of these duration as we go along. For the time being, I hope I have made it simple enough to understand.

Then lets get confused now. Market Pundits did not stop at creating MAs and live happily thereafter. They added further spice in it by creating variations of these MAs. There are many but the ones you can actually hear some place are;
  • Simple Moving Averages (SMA)
  • Exponential Moving Averages (EMA)
  • Cumulative Moving Averages
  • Weighted Moving Averages
  • Wilder Moving Averages
We will be talking about only the first two of the lot. These are the ones that you will actually come across and use for trading.

Right now I am way past my Average sleeping time. I have not crossed it if I take Moving Average of last 30 days though. Will write next one quicker than you think.

June 21, 2012

Tutorial Post

Guys, finally, I have managed to make our continuation post on Technical Tutorial. As earlier I have made this post on Equity Blog. You can read it here.

As usual I will wait for your comments and thoughts.

Giving everything to make a trading post possible by weekend. Wish me luck.


June 20, 2012

NIFTY Charts - 2

Well, finally I got my data back (and half of my life with it). Without any delay, I will post the charts I was talking about.

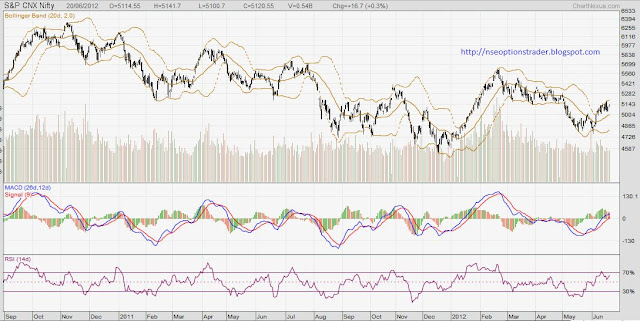
Chart 3: NIFTY with Bollinger Bands


See how religiously NIFTY has followed the band. Bollinger Band as a Technical Indicator will be dealt soon but understand that the central line is a moving average line and two dotted lines are +/- standard deviation with respect to mean line. These two dotted lines act as Support and Resistance and width of this band indicates the volatility in the market.

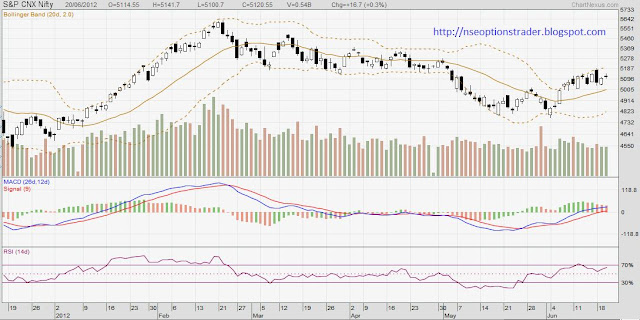
Chart 4: NIFTY with Bollinger Bands


There are few more terms for Bollinger Bands like Bollinger Squeeze which we will see during tutorial. Earlier I said that I see something interesting with Bollinger Bands... was actually a false flag so no special case here. But thing to notice is Band was widening (volatility was increasing, no brainer) but now it seems to be settling down. The MA line is sloping up and usually price tends to return to mean band value.

I will keep updating these and more charts regularly.

In Europe, Greece is settling down with fresh Government. In India, Pranab Da Vs Sangma for President is like Saina Vs Myself in Badminton so no worries there (all right, I am not that bad). We badly need a new FM so Pranab should get in Rashtrapati Bhavan. Best Part of this week was RBI Action. We will realize correctness of this move only in the hindsight.

One last update is I have opened a twitter account for this blog (@Ethical_Trader). This will help me convey anything important in real time. So you guys are welcome to follow

 I have also added my timeline on this blog so you can follow it without Twitter too. See on the right side.

Will post tutorial in a couple days. Will also see if some trading post can be made. Life is getting back to normal and lets hope it stays so.

June 19, 2012

Got the data...

First up good news... Hard drive data has been retrieved. Bad news, cannot get it today. Can collect it tomorrow. So guys, please wait for a day more for the charts.

Another text post in between should keep you entertained... Before we talk about markets or economy, would like to answer few comments made by readers on the blog.

First, it had been asked many times, but the answer is no. I am not a market analyst. The only market connection I have is through my dad who also used to be an active trader once upon a time. Learnt most of the things from him. Otherwise I am just a normal person working in IT. So sorry to disappoint.

Then second regarding continuity in blog... Those of you who have read this blog from start would know the Genesis. I started writing here for few of my friends who were never tired of asking me same questions again and again. I was tired of explaining them so on advice from one of them started penning down my thoughts. Surprisingly I also started enjoying and so I continued. I do not know how but I started getting lot of other visitors, readers and hence expectations started to rise. It was not possible for me to write everyday as I said I am neither a professional trader not an analyst. I am just a normal person who have relatives getting married, falling sick, who goes on vacation in summer and also goes on site as an IT worker and sometimes just chill out.

Honestly with the mails, comments I am getting, I would want to write everyday. That, friends, is not possible at least till end of this month. We will see how it goes after that.

Then the questions regarding posting of daily supports, resistances, trades, etc. I feel this blog may not be the best place for it. I do not have access to it all the time. Will work out something.

After all this rant, let's also talk some business. As for the markets, it is a dull and flat world. We are probably waiting for formation of government in Greece or some other event to get clue. Till such time sector or stock specific muted action will keep happening. QE3 or another LTRO is what market participants may be hoping for which may do more harm than good in the long term.

But the real action, I feel is going to unfold in commodities. Watch out all precious metals and crude. Will make a techno-funda post on them at the opportune time.

Will write more soon. Till then, happy trading.

June 18, 2012

Greece proposes RBI disposes

Well, what else can I say?

Greece results, though very close, allayed lot of fears around the World. Announcement from New Democratic party that Greece will remain part of Europe was a Masterstroke. We would have done very well and important resistance levels on the charts would have been taken out had RBI not spoiled the mood of the market.

But honestly, not cutting the rates is a good move I would say. Cutting the rates does not impact either inflation or growth in present context. These are affected more today from supply side constraints and policy paralysis respectively. RBI is right in keeping the real interest rates in positive territory (higher than inflation). In any case weaker rupee is better for us as I said earlier. A trader in me would have benefited with a rate cut though. Some other day perhaps.

Update on my hard drive; things are still bleak. Not much sure whether it will be back today.

Bear with the text only posts till then please.

June 17, 2012

Greece Elections Update

Polling is over in Greek Elections. As per the first exit polls, New Democracy (27.5% to 30.5%) and Syriza, anti-austerity party (27% to 30%) are neck to neck and the actual picture may become clear very late in the night.

Half a percent point is too close to call and no central banker or politician in Europe is sleeping tonight.

As for my Comp; I am not able to install charting software on my office laptop hence unfortunately cannot upload charts here. Will try to recover data from hard disk tomorrow and should post one thereafter. Till then these small posts will have to make do.

Sorry folks

My computer hard drive has gone bonkers as I kept it on yesterday night. This post is just to tell you guys that all my chart images were stored on it. So as I said that I will be posting few more charts with Bollinger Bands looks difficult. Will try and post them tonight.

Also there are some serious date mistakes in last post. Will correct those when online again.

NIFTY Charts

This post will be mostly about charts with little commentary. It will also help me regain some perspective about technicals of the NIFTY. Been writing and thinking too much about fundamentals.

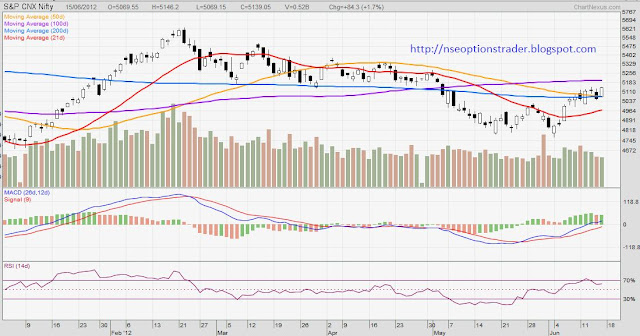
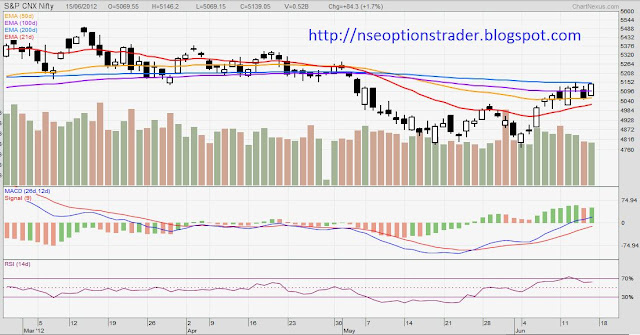
Chart 1: NIFTY with various Simple Moving Averages


Note: 50 and 200 SMAs are almost at the same level and NIFTY is resting on them from the top side. 21 and 100 SMAs are sloping up.

Chart 2: NIFTY with various Exponential Moving Averages


Note: I personally prefer EMAs than SMAs and I know that I need to do a post on them to explain why. These MAs will be the first when I start tutorials again. Here 21 EMA is sloping up, 50 EMA is getting flat and downward slope of 100 and 200 EMA has reduced. Note that NIFTY touched 200 EMA from bottom on Friday. 200 EMA usually is a tough cookie to crack and is a strong support or resistance.

I am studying couple more indicators and finding some very interesting stuff with Bollinger Bands. Want to include those charts here but it will get very lenghty. Will make another post with couple charts in the morning. Tomorrow I have taken a day off so it should be possible.

Thanks a lot for hanging in here. As usual, keep your comments coming in; they push me to write more.

India at Crossroads - 3

This will most likely be the concluding post on India and World Economic fundamentals for the time being from my side. I am eager to get back to trading posts and our technical tutorials and I hope you too are looking forward to the same.

Well, as I said in last post that I have a project deadline this month and have been working weekends too; but couldn't resist this post since next week is so important on so many counts. And most important day of this coming week is not Monday... it is Sunday for a change. Today (it is already Sunday) we will have voting in the Greek Election. As you would recall, last election resulted in no clear majority with Radical Left parties scoring high. All their attempts to form a Government in May failed and hence another election. Already Europe and rest of the World is watching with held nerves as to what will happen in Greece. Powers that be in Europe and across the World would have already tried all tricks to secure win for Parties they prefer.

These Elections will close for voting at 5:00 pm Athens time with Exit Polls following immediately. Initial estimates of the results will follow in couple of hours and clear picture will emerge before midnight in Athens. Various polls have shown increased support for Left parties but stakes in this Election for entire World are too high and 14 days old polls (as per rules in Greece, all polls have to be before 14 days before poll date) can not be relied upon. This one single event will decide the course the World markets and economies will take in the short to medium term. Central banks from Frankfurt to London, Tokyo to Beijing are all on the edge awaiting what Greece is thinking and for good reason.

Then off course we have RBI meeting on 18th. Indian markets have already factored in 25 basis point rate cut amid contradicting statements from RBI and Finance Ministry officials. A higher rate cut will rejoice market but if RBI gives in to the threat of adamant inflation and does not cut rates we may see some sharp correction. Some cut in CRR will anyway happen me thinks. But to be honest, India does not look very good as a developing economy and the condition here looks more and more like stagflation (need to do a post on that perhaps).

Then there is another issue of Presidential Election in India on 19th (July) with results coming in on 22nd. I really wish, Congress should have shown this fighting attitude against Didi during FDI in retail debate. We would have been in far better situation today. But Pranab Da getting out of Finance Ministry is also a huge positive for India. Though I like him intellectually, he has failed miserably as FM. Almost every parameter measuring Economy is worse than the time when he took over. I really wish that he wins for the simple reason that we get a new FM. C Rangarajan would be my choice but I can settle for Manmohan Singh too.

These events will have a bearing on Markets in next week and volatility may remain high. It is usually a good time to make money by using Strangles or Straddles. Personally I am not in a position to take a call as to which is the likely direction for the markets. Last month and a half has been crazy so no shame in admitting that I am a trader who does not have any opinion on the market. In such situation I will do what I do best. I will look at the charts and see if they tell me something.

Hang on, I may post another one in half an hour. Its been long since I posted some charts.

June 07, 2012

India at Crossroads - 2

Lets continue our discussion from last post. Before that, got some queries about DXY and where can it be seen. Here is the link.

Now, as for the Rupee level, as I said, I would like to see Rupee find its level naturally. There are few reasons for that. First of all, RBI does not have luxury of excess reserves which it can afford to splurge on supporting rupee. Our reserves are a phony figure because we run both Current Account and Fiscal Account deficit and we need those reserves as a cushion unlike China which actually have real reserves due to its huge trade surpluses with rest of the World.

INR at 56 or even 60/$ can bring some good news for Economy. At this level, even the brain-dead politicians will realize that they cannot subsidize petroleum products endlessly. They have to (had to, already 7.5 hike and 1.6 rollback has happened) pass on some burden to users. When this happens then users tend to use these products judiciously. Also the industries which are importing raw materials will feel the pinch and will want to improve efficiency to reduce this added cost. People who want to go for a foreign tour (on a budget) have a re-think and may settle for vacation in India this summer. NRIs will want to use this opportunity and send some more money to India. All in all, demand for Imports goes down, $ inflow starts to get better.

However, real advantage of falling Rupee is for Exporters. Imagine a case where I am making something at INR 60 and I want to export it. When INR/$ was 50 I would quote my price at 1.2$. I may be competitive or I may not be. Rupee depreciation gives me the liberty to quote my product at 1.0$. If I am facing the competition then I would reduce the price in direct co-relation. If I do not have competitive pressures, I would improve my margins and pass on only some part of depreciation to my customers.

Simply out, China today is the manufacturing power-house of the World not because of a strong Yuan. On the contrary, keeping Yuan artificially low as the state policy is the single biggest factor which helped China have massive reserves and trade surplus with every other nation in the World. We Indians, tend to think emotionally and feel bad when Rupee slides against $. We take pride if Rupee is stronger and start to feel as if we are already developed nation.

Thinking just little below the surface will expose how strong rupee is a bad thing for us right now. in 1990, we were forced to devalue the rupee. Now it is happening on its own. Situation in 1990 and today have a major difference which is state of the Private Sector in Economy. In 1990, our companies were all working like Government Organizations, no competitive edge, no global operations, no real profits or cash. Today our Private Sector is much more vibrant and in a better condition to exploit the weaker rupee. We can get many BPOs back from the Philippines with he help of weaker Rupee and create some jobs for the youth. These are the people who are driving the Indian Consumption story and closure of BPOs is a blow for them. There are already serious indications about even the Consumption is going down and there is a simple co-relation between more unemployed youth and less public spending. A weaker rupee can set these things right in a very little time.

Have been writing this post in bits and pieces so you may find it lacking continuity. My apologies for that but my Project deadline is in this month and I am really stretched thin in various directions. That will not stop me from writing though. In the next post, I will probably touch upon what I believe will happen and how the things will pan out for India, Markets, Gold, etc. I also have to write about the Credit Card query and I really feel bad for not doing that.

After these couple of posts and after my project is over, I plan to consolidate my blogs in one. That will simplify things for me and then we will carry on with trading posts as well as Technical Analysis tutorials. Lets hope God does not dispose what I propose. Keep your comments coming in. They push me to write more.